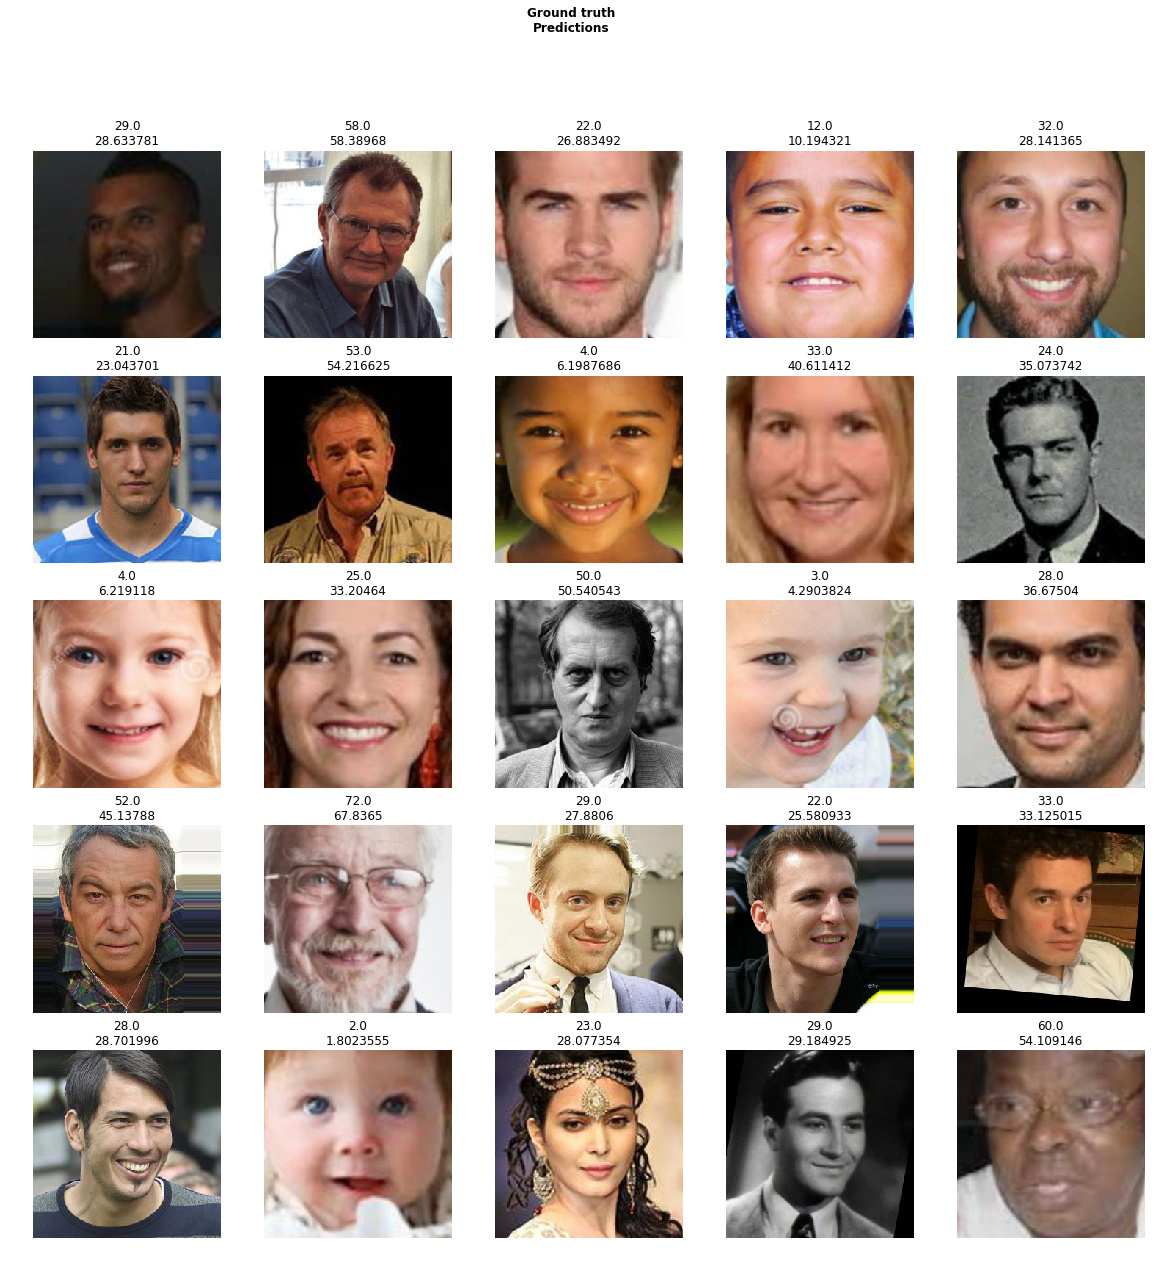
In my recent medium article, I wrote about a project in which I created a CNN based model to predict the exact age of the person given his / her image.
This is the link:
There are many new things I learnt while working on this project:
Reconstructing the architecture of ResNet34 model to deal with Image Regression tasks
Discriminative Learning Technique
Image resizing techniques
Powerful Image augmentation techniques of Fastai v1 library
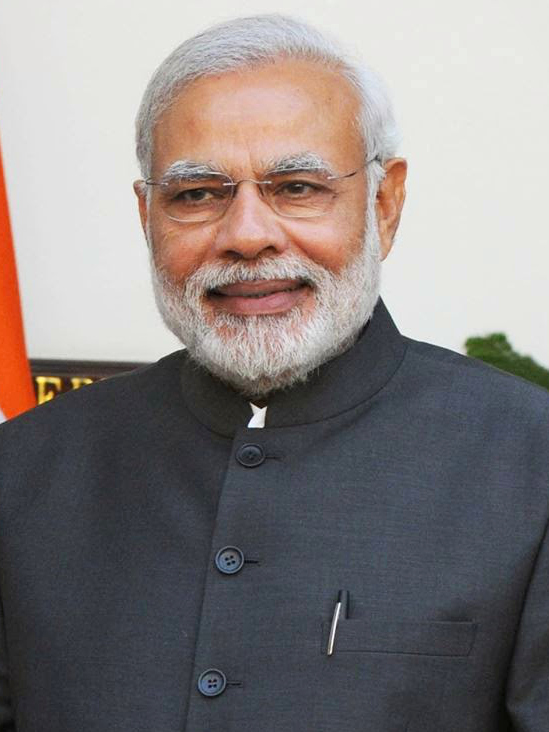
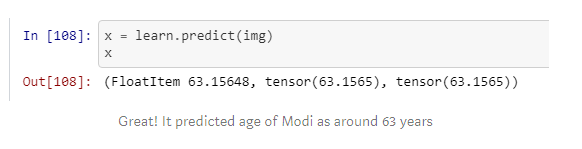
As a test image to validate the prediction accuracy of my model, I used India’s PM Modi’s picture which was taken in year 2015 (when he was 64 years old) and checked the result:
Racket Classifier
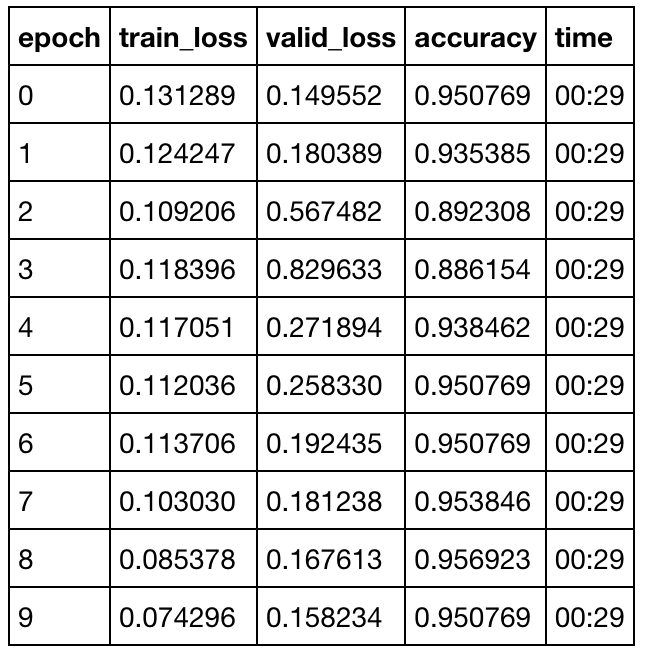
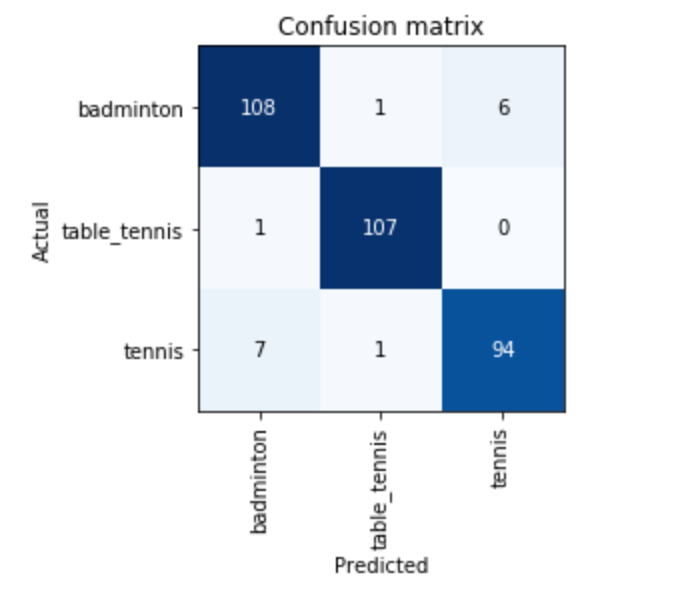
Created my first GitHub entry, to create a classifier identifying Tennis, Badminton and Table Tennis rackets. I was surprised to get to 95% accuracy. The confusion matrix also makes sense that a few badminton and tennis rackets look similar in a few angles/crops.
PS: github also has the cleaned URL files if someone wants to replicate it.
This being my first GitHub entry, looking for experts to point out issues / mistakes / suggestions to make it better!
With a bunch of tree-friendly volunteers from Data for Good, we’ve been working for two months on a wildfire detection system! Following up on the increasing severity of forest wildfires across the globe this summer, we started interviewing firefighters and surveillance teams in southern France to gain some field expertise: with the adoption of cell phones, detection itself is not an issue anymore but early detection is crucial to contain the fires.
Existing approaches leverage high-end optical equipment but don’t make the most out of the processing part, whereas we believe that wider accessibility comes with lower deployment costs.
Our first draft is quite simple: train a reliable detection model, get it to run on Raspberry Pis and place those on existing surveillance towers.
Collecting data from publicly available images, we trained a single-frame classifier using the learning of first fastai lessons. We released a first version of the library earlier this week (available through pypi as well) including our image classification dataset and a light-weight model (mobilenet v2) with an error rate lower than 4.4%
The project is open-source and our goal is that anyone with a Raspberry PI (and its camera) can download and install the inference model easily at home completely free of charge.
We are always looking at expanding our datasets and improve the model so any feedback, suggestion or contribution is very much welcome
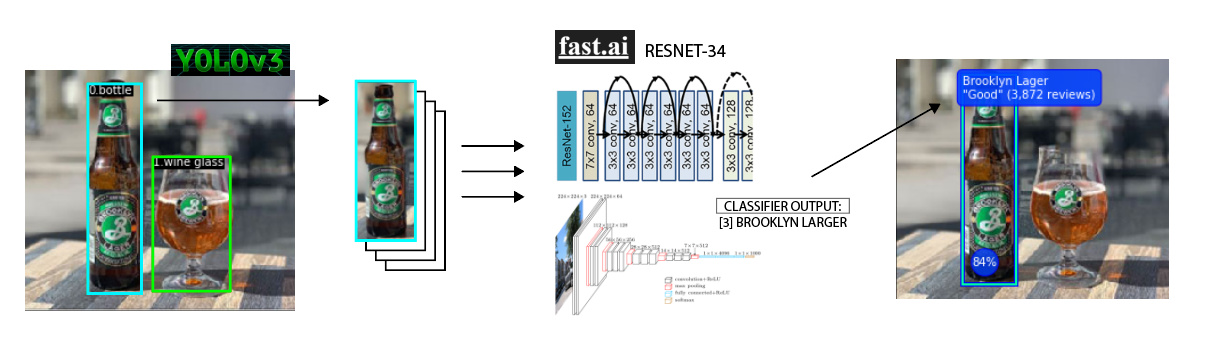
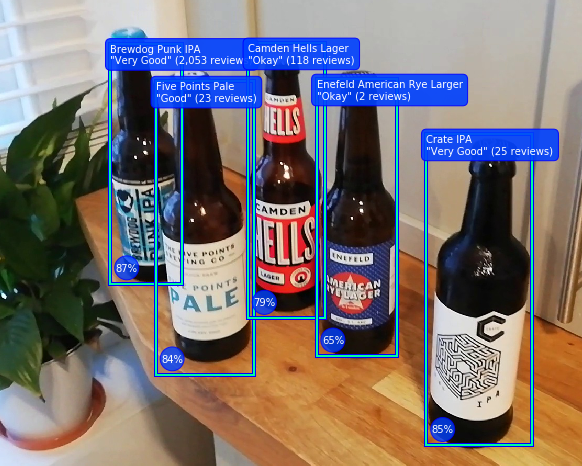
I wanted to create a craft-beer identification network which would tell me quality/rating of a beer from an image. I realised early on that I couldn’t just use the lesson 2 classifier, because this problem requires not just image classification, but segmentation too. When there are multiple craft beers in the frame, I need to return different predictions to different coordinates.
The way I solved this was, first using this pre-trained pytorch implementation of YOLOv3, to segment and draw bounding boxes around the 1000 (possible) classes in imagenet.
Then, if the detection class = 39 (a bottle), I would pass this cut-out to the custom trained FastAI resnet model, and display the results as an overlay on the original image.
The code works well, but of course there’s the limitation that it only classifies beers that I’ve already looked up and created a dataset for. I can imagine some kind of future work which automatically adds brands to the model by scraping Google Images based on a master-list, then using YOLOv3 to extract bottles from the search results, and then running those images in training.
Also I have a short video of it running on my GitHub, but it would need some considerable refactoring to make it actually run in real-time (and beyond the scope of this hobby project)
This is so cool… I think this gives me some answers I have been looking for (multi object in single frame and also “I don’t know” answer from classification).
I am going to try this and bother you if I get stuck.
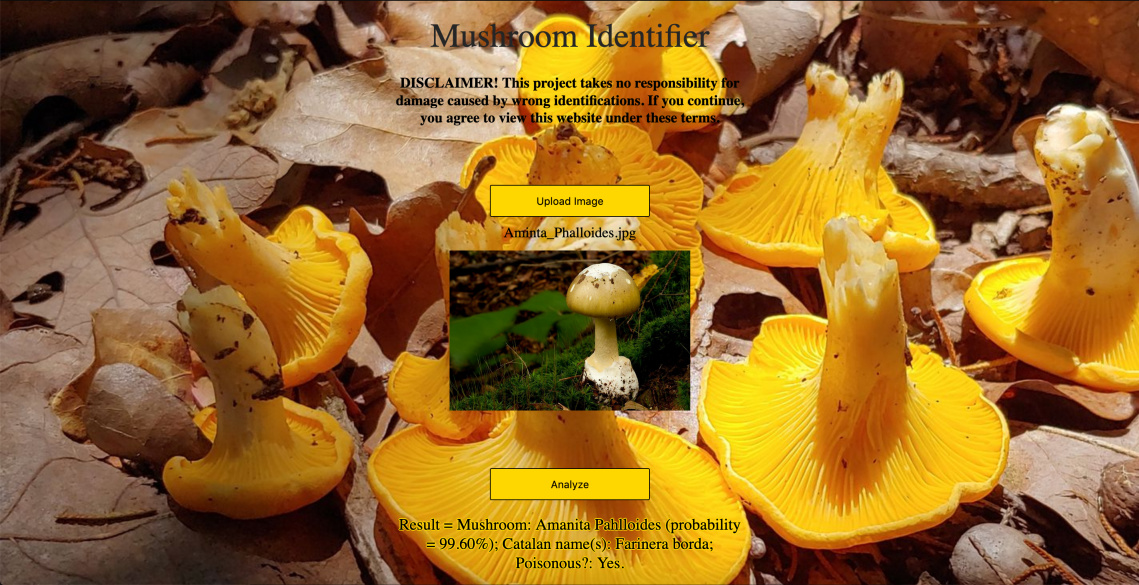
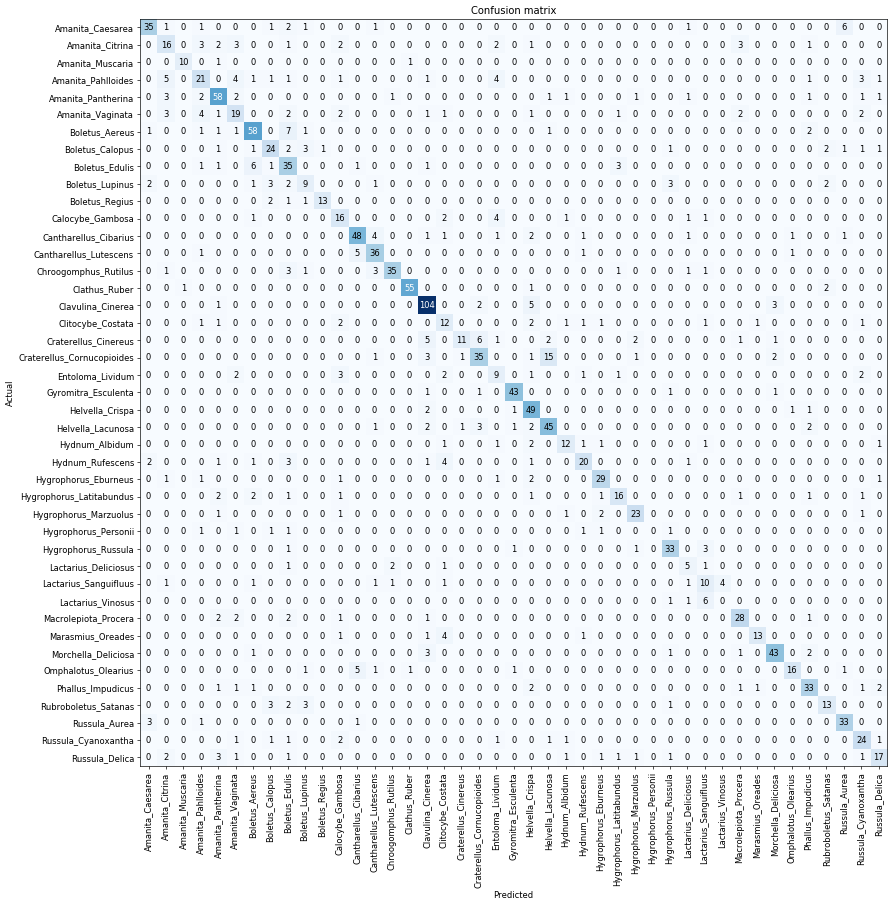
I want to share with you a project in which I have been working last weeks. It is a Mushroom identifier web app (based on Shubham Kumar repo) that uses a resnet34 model to make the predictions.
The dataset has about 8000 images of 43 mushroom classes, and the achieved accuracy of the model is ~90.4%. I think it’s quite a good value taking into account the difficulty of image recognition for mushrooms. The majority of the most confused mushrooms would probably not be correctly identified by expert mushroom hunters based in a single image!
When showing the results, I would like to show which are the mushroom classes that use to be confused by the predicted class, but I didn’t found a way to do it.
If you have any suggestion, comment or doubt about the project I will be happy to hear you!
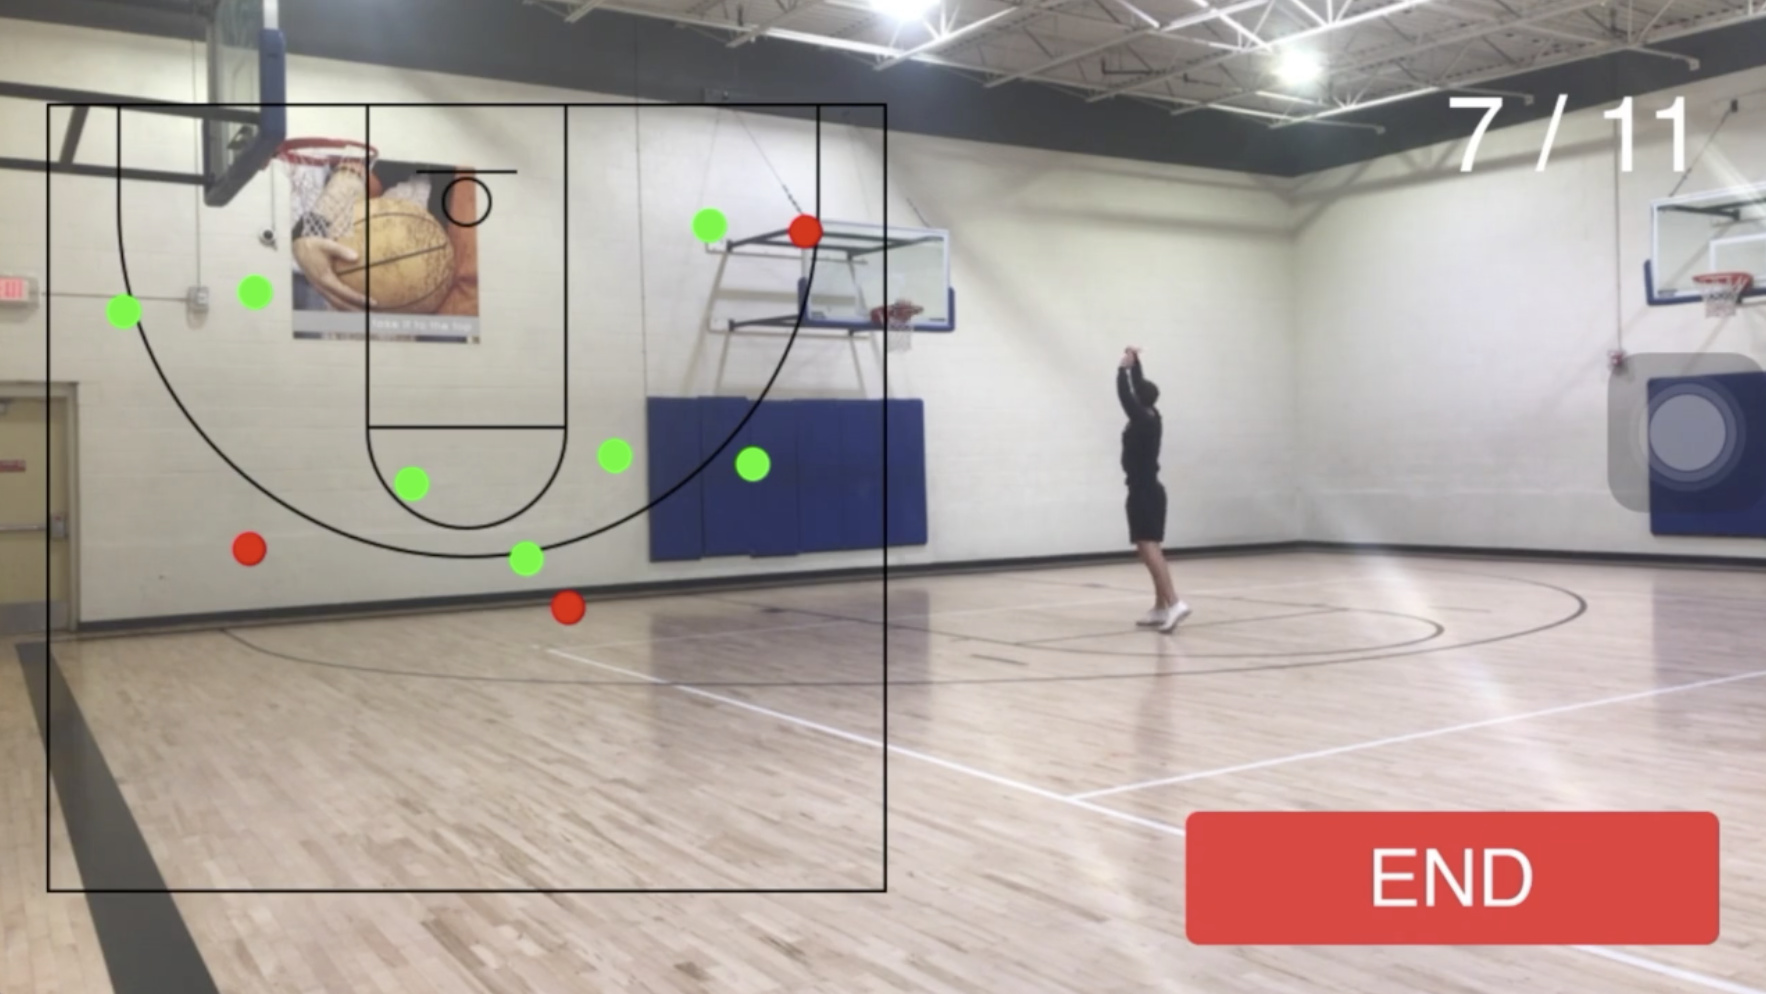
Any basketball lovers out there? I created an iPhone app that I now use to keep track of my shooting progress. All I do is attach my phone (iPhone 7) to a tripod at the gym and it locates where I shot from and whether it went in or not.
Hi Jordi. This is a cool project, and one that is close to my kitchen and heart! 90% accuracy seems very good for a single photo. As you noted, the other 10% might kill you.
When showing the results, I would like to show which are the mushroom classes that use to be confused by the predicted class, but I didn’t found a way to do it.
You are very close to what you ask for. I did this a year ago with imagenet categories, so please forgive me if my memory is not entirely accurate.
This cnn model outputs activations for the 43 classes. fastai automagically applies softmax activation and nll_loss to these activations. I am not sure how well this invisible process is documented, but you can see it by tracing fastai with a debugger.
So first define your own loss function that does the same as fastai and assign it to learn.loss_func. This assignment prevents fastai from automatically deducing the correct activation and loss functions. In your loss function, between softmax and nll_loss, you will find the probabilities for each class. Then you can list the probabilities of the most likely classes.
Note that these class probabilities are relative to each other. They will tell you, given the image, which classes are most likely, but they will not tell you that there is no mushroom present of any class. For that, you would need to train with sigmoid activation and set a threshold. I make this comment only because it is a recurring question on the forums that has not been clearly and definitively addressed.
Have a file at work with ~300 data points. I have about 4 features and want to predict a continuous variable.
For my workflow at the time I just used a multi variable linear regression model on all the data. However, seeing how easy to use a NN to this dataset I wanted to give it a go.
By definition I am overfitting the data as I am fitting a model to the ~300 points then seeing how well it predicts itself. I am not creating a prediction tool this was more of an understanding exercise of the data as well as learning about Tabular learners.
Documenting my learning’s here:
test = (TabularList.from_df(df, path=path, cont_names=cont_names))
data = (TabularList.from_df(df, path=path, cont_names=cont_names, procs=procs)
        .split_none()
        .label_from_df(cols=dep_var)
        .databunch()
       )
data.add_test(test)

nn_arch = [800, 600, 400, 200] # Length is number of layers and value is number of hidden units in each layer
learn = tabular_learner(data, layers=nn_arch, metrics=r2_score)
...

preds, y = learn.get_preds(DatasetType.Test)
targs = torch.tensor(df['dep_var'])
r2_score(preds, targs)
Started this off mainly because I hated how fbprophet didn’t force the output into the higher and lower bound that was set, so I created a class that does just that, and finding how easy it is to do that thanks to Jeremy’s lectures:
Hi stev3 Nice app!
I’m intrigued how did you train your model? Did you take a video and split the frames into various classes, such as position and score or miss?
Hi @hkristen
I’ve been recently playing with camera traps datasets, so maybe my notes will be helpful for you.
Many nature-related datasets are here: http://lila.science/datasets. Especially interested is Serengeti Dataset. It’s huge, but you can download single files as well:
Hi, this my first post! I am from Colombia and this is my first mini project from lesson 2.
Because we use jupyter notebooks on a daily basis, I decided to build a classifier in honor to this wonderful project and also to the father of modern science, Galileo Galilei, who discovered the four largest moons of Jupiter: Io, Europa, Ganymede, and Callisto.
My dataset was obtained from google image search and using the defaults parameters for the resnet34 model, I obtained a near to zero error rate.
Hi all!! I started the course a few weeks back and just after the second lesson, I made a classifier to distinguish between bulls and buffaloes. https://isitabull.onrender.com/
I created a proposal for the society of actuaries predictive analytics contest and won second place. Any suggestions on how to improve the model are welcome.




 I am from Colombia and this is my first mini project from lesson 2.