Hey Maria
Are you an actuary? Nice to see here a member from my community 
Nice work and congrats! Can you please let me know where do we find details for such competitions organised by SOA?
Regards
Abhik
Hey Maria
Are you an actuary? Nice to see here a member from my community
Nice work and congrats! Can you please let me know where do we find details for such competitions organised by SOA?
Regards
Abhik
Hi All,
I am a relative newbie to this forum. I am using Google colab to run the fast ai notebooks. one of projects that i am running is to identify aerial images of different infrastructures (like schools, airports, etc.) I have downloaded images from google but the fastai model is pretty noisy with a very high error rate around percent and looking at the learning rate graph. Nothing much is help but lower learning rates are leading to spike in the error.
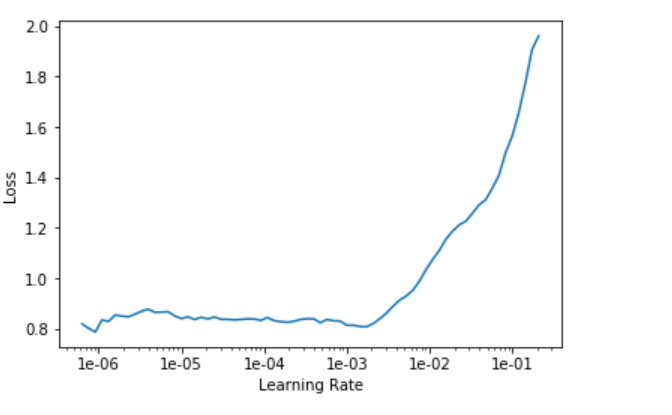
even after optimizing the learning rates, I am not able to reduce the error rate to less that 25%.
Is this a hard problem for CNNs to figure out or is there a data error. I am unable to figure out. Any help is welcome.
Thanks
Ramesh
Hello Abhik:
Thank you for your message. Yes, I am an associate of the society of actuaries (ASA). Nice to see more actuaries here as well. For the competitions organized by the SOA, there is no specific place that I know of where the competitions get announced, it is usually by email. The active involvement programs that I know of right now are the Kaggle/SOA involvement program https://www.soa.org/programs/predictive-analytics/kaggle-program/ and the call for essays in actuarial practice and innovation https://www.soa.org/research/opportunities/actuarial-practice-innovation/
Best,
Maria
@Jabberwocky From my experience with a classifier that I tried to get working to identify four classes of Boeing’s commercial airplanes, I think the issue was the quality and quantity of data. The difference among them are very subtle and also you have to deal with airplanes with different colors. I never could obtain an error rate below 0.46
I used around 200 photos per class.
I’m sure you could do this in google colab! They make it a bit difficult working with cloned repositories… I think what you need to do is download the repo/zip file into a google drive folder, and then you can right click a notebook to open it in colab.
Colab for this kind of thing is a bit messy though. What I like to do is development on my local machine, especially this project because it involves a lot a image/file management, then only run it on a cloud GPU only once everything is in place and running the way I want it to. It’s just the training that needs a GPU. I’d say I spent 90% of my time building the inference loop and OpenCV/matplotlib image formatting, so that was fine running on my local machine’s CPU.
I think the architecture is cool because it isolates the target and that makes it a much better image-classification problem to solve. Whether running two networks at once per image is the optimal way to do it…? I’m not so sure!
Thanks. I looked at the data as well. Maybe i have to start with a problem that is a bit more tractable and move from there.
I have adapted the lesson 1(2019) of the course in my blog. I had tried to keep the code same as taht of the lesson1 (but with a different dataset) so that this blog can be used as a written version of the video lesson.
“Deep Learning: A Step-By-Step Guide Using Fastai” https://medium.com/ml-and-automation/deep-learning-a-step-by-step-guide-using-fastai-9a5c55f9e4ce
Hi! I built a quick video-to-frame labeling tool for ML models. - I am using it in a custom classifier with transfer learning and collected a bunch of long videos for my application that I needed to label fast. Here the code if its useful to you: https://github.com/Mascobot/video_frame_classifier
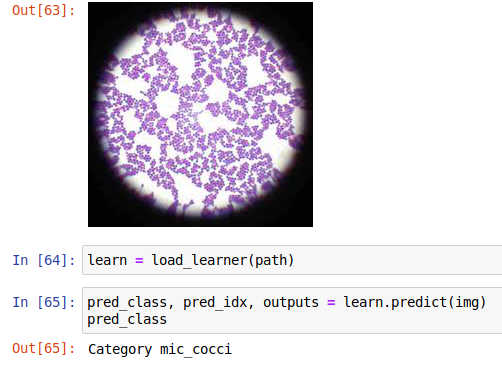
Just built a custom classifier for microbe classification. It can recognize bacilli (rod-shaped) and cocci (circle-shaped) bacteria at error rate of 4%, despite different zoom levels, brightness, and contrast.
To say I’m excited at what fastai can do is a massive understatement.
Hi All, I am applying multi-class classification in micro expression and gender classification. I created my data set with a label like this.
anger_boy, anger_girl, happiness_boy, happiness_girl, repression_girl, repression_boy
However unlike amazon multi-class classification, here only 1 in each class is possible. so is it possible to get the result efficiently in this architecture?
As I am getting 3 labels(boy girl sad) at a time with threshold 0.2 which is not possible in my case.
Please review and suggest if you have any idea to how to make it better in any way.
Link to the Notebook.
Thanks in Advance.
Here’s what I wrote after two lessons! (in Spanish)
Thanks to fast.ai & its community!
I know this isn’t a great error rate, but for Lesson 1, not knowing what I’m doing and using a fairly small data set (~200) images. I feel pretty good about this model!
I was surprised how well back/front yard was predicted. The one interesting one was the back yard with the couch being categorized as a living room. In retrospect I should’ve added a patio category to account for something like that.
@simonjhb and I just published the first blog post about our experience on Lyft 3D object detection competition
Eventually we ended up with a custom model, starting from the Lyft public kernel and borrowing a lot of ideas from PointPillars paper and Entity Embedding paper.
To find a way to leverage both point clouds and camera data, we trained the network starting from a Semantic Point Cloud where the semantic class of each point is treated as a sort of 2D Categorical Variable.
In the road of bronze medal, we faced a lot of challenging and interesting problems such as:
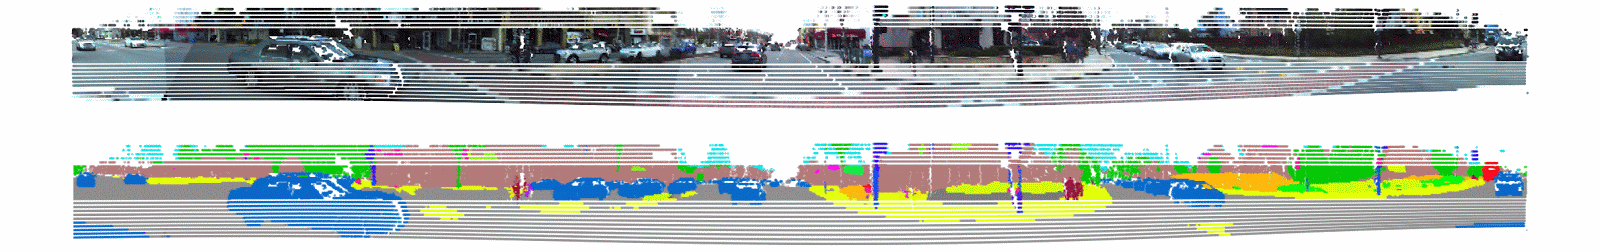
Dealing with pretty big dataset (around 120GB) and the consequent need of focus on performance for almost any task, rebooting our GCP instance with T4 gpu for training and 32 cores and no gpu for post-processing.
Lot of pre & post processing: with a lot of linear algebra to manipulate point clouds, old school computer vision tricks (ie: contours, erosion & dilate…) and pretty advanced Pytorch techniques like grid_sample and scatter data operations that made it possible to deal with such amount of data.
Leveraging fastai with plain pytorch model focusing on training loop, datablck api and custom transformations to deal with tensors with both both continous and categorical channels.
We’re releasing the code on github soon along with more deep dive articles on the various techniques we’ve used.
@ste this is absolutely awesome! Very well done! I can’t wait to see the source code and read more of the articles. There is so much to learn here ![]()
Hi Dave, fabulous work! It’s overall inspiring! btw, I really interested in the work of preparing the dataset, as you mentioned “convert geojson and crop individual buildings …”. would you like to share some experiences about those? that would be great helpful! thanks in advance!
Will
Hi everyone,
I’ve been working on a fastai version of the segmentation part of https://mateuszbuda.github.io/2017/12/01/brainseg.html - in which Mateusz achieved “83.60% mean DSC and 87.33% median DSC”.
It would be great if someone can take a look at https://www.kaggle.com/peter88b/brain-segmentation-fastai/output?scriptVersionId=24252708 to see if I’ve made any mistakes because … I’m getting a dice score of just over 0.9 - which looks like a significant improvement - but I’m not 100% sure my results are directly comparable.
I’ve made both the training and inference notebooks public:
https://www.kaggle.com/peter88b/brain-segmentation-fastai
https://www.kaggle.com/peter88b/brain-segmentation-inference-fastai
Thanks,
Pete
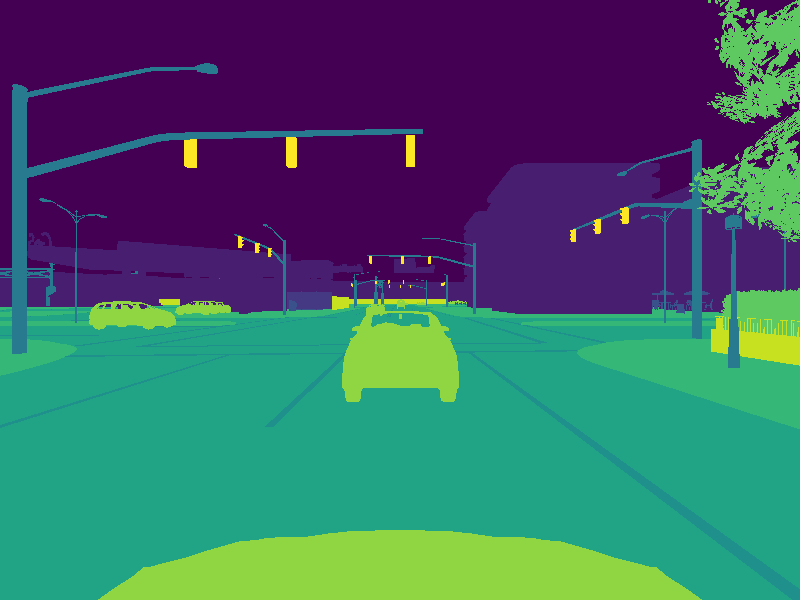
Hello everyone,
I created my own image segmentation dataset by using the Carla Simulator. Here is an example from the dataset:
I then trained a model on the data, and it worked quite well. If you are interested, have a look at my Github repositories:
My Dataset for image segmentation
Tutorial on how to create your own dataset & Code for training a UNet model on the dataset
There is only one point I´m not happy about. I noticed that ImageSegmentationMask.show() function sometimes switch the color palette. I checked the mask arrays, and they have exactly the same codes, so it seems that this is not an issue with my dataset but with the plot function used. Does anyone know a way to fix that?
My audio project Manatee Chat first demo! Took me about a year to get here… It is still struggling with partial manatee calls, but it is getting better. It was trained on a small dataset and I did not use any transformations or augmentations yet (it will be the next step).
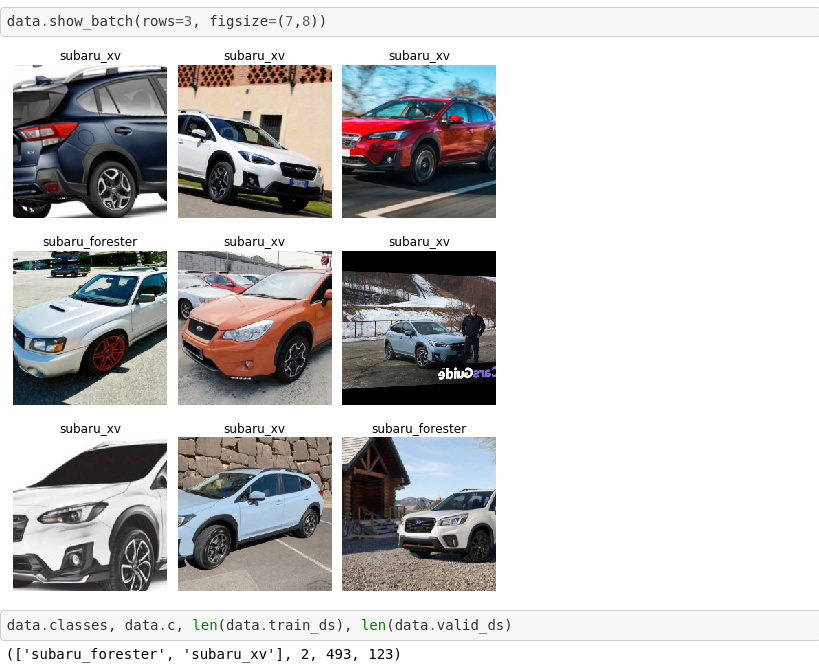
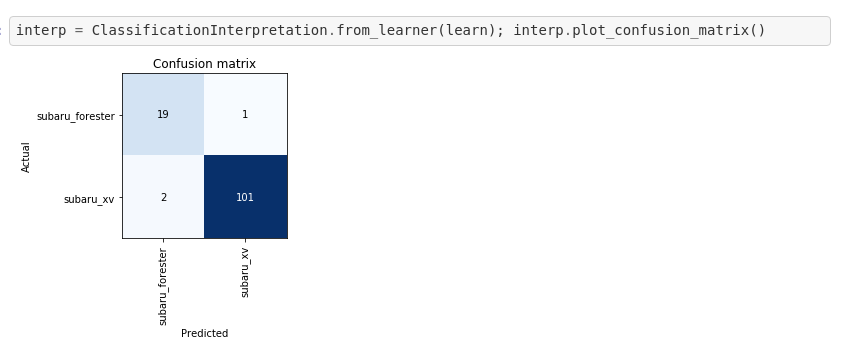
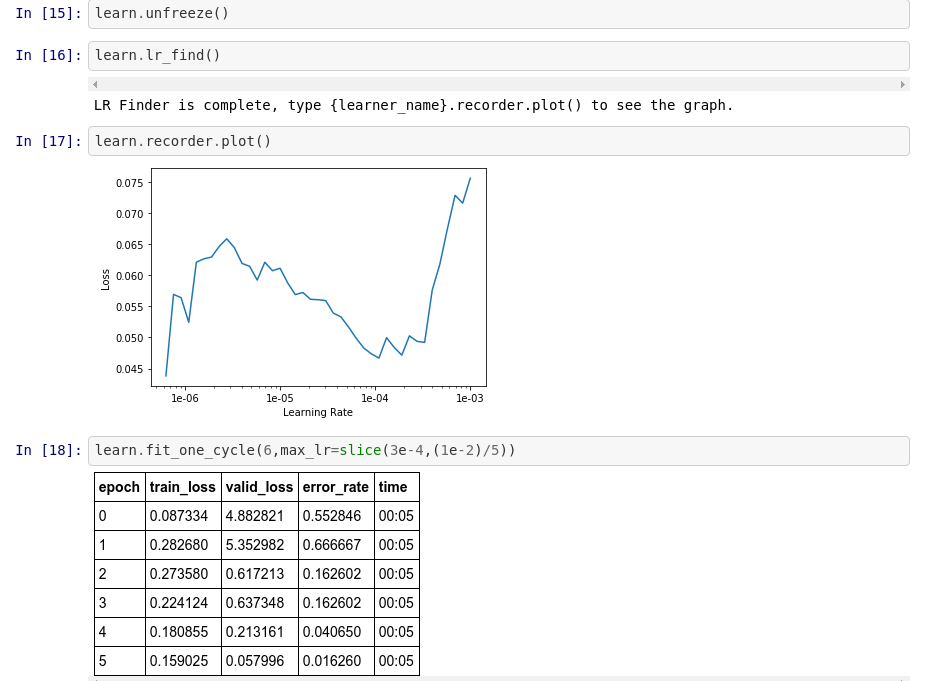
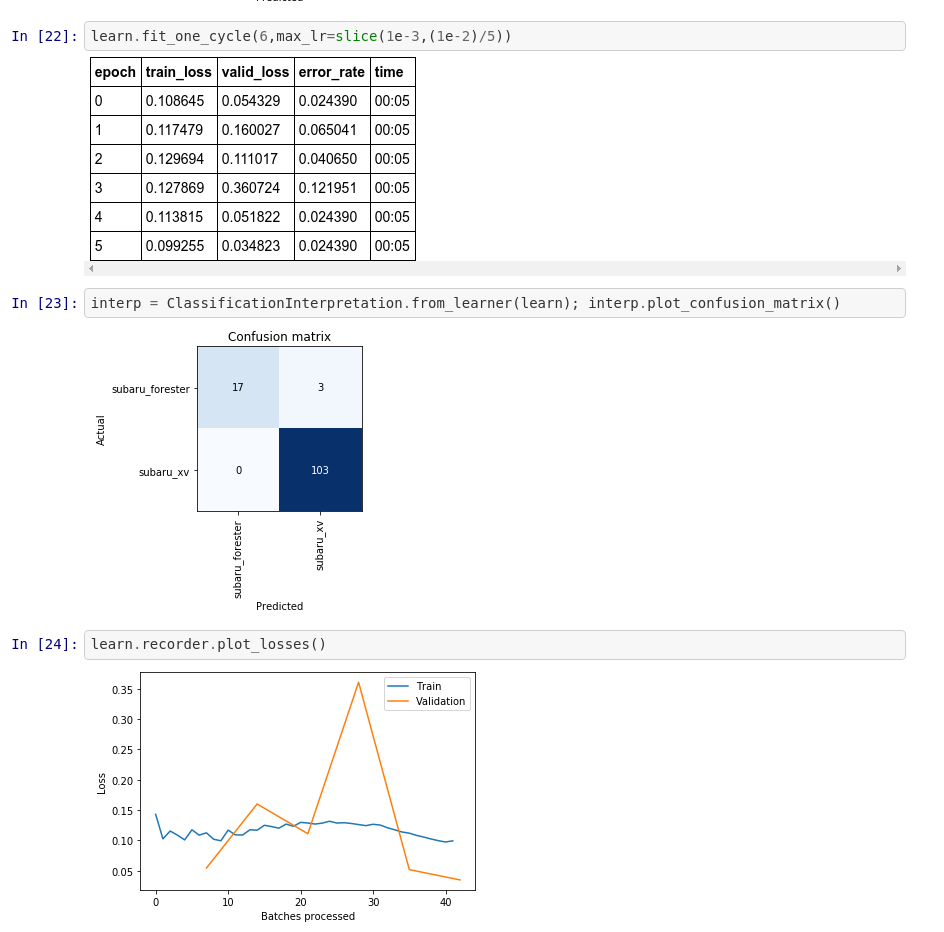
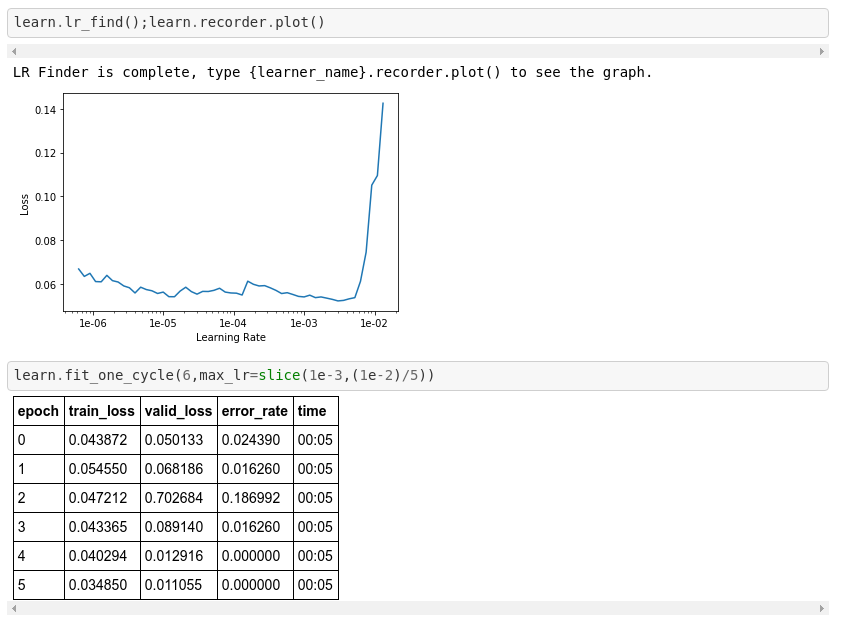
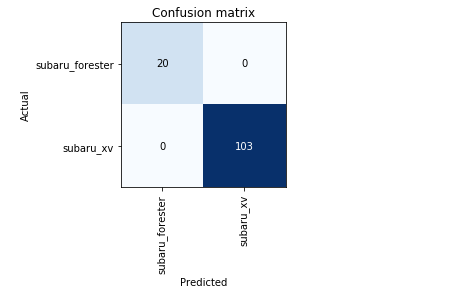
I started working through the first Lectures and wanted to share my initial project. As a Subaru fan, I wanted to create a classifier that distinguishes between two of the models, Forester and XV, which happen to look somewhat alike (being that one is a cross-over and the other a compact SUV). This and the fact that there are several generations of the models make the task at least mildly interesting/non-trivial.
Here is a preview of the data:
thanks, has anybody tried LIME on text data ?. Any other explainability tools / packages that is good.