Eventually we ended up with a custom model, starting from the Lyft public kernel and borrowing a lot of ideas from PointPillars paper and Entity Embedding paper.
To find a way to leverage both point clouds and camera data, we trained the network starting from a Semantic Point Cloud where the semantic class of each point is treated as a sort of 2D Categorical Variable.
In the road of bronze medal, we faced a lot of challenging and interesting problems such as:
Dealing with pretty big dataset (around 120GB) and the consequent need of focus on performance for almost any task, rebooting our GCP instance with T4 gpu for training and 32 cores and no gpu for post-processing.
Lot of pre & post processing: with a lot of linear algebra to manipulate point clouds, old school computer vision tricks (ie: contours, erosion & dilate…) and pretty advanced Pytorch techniques like grid_sample and scatter data operations that made it possible to deal with such amount of data.
Leveraging fastai with plain pytorch model focusing on training loop, datablck api and custom transformations to deal with tensors with both both continous and categorical channels.
We’re releasing the code on github soon along with more deep dive articles on the various techniques we’ve used.
Hi Dave, fabulous work! It’s overall inspiring! btw, I really interested in the work of preparing the dataset, as you mentioned “convert geojson and crop individual buildings …”. would you like to share some experiences about those? that would be great helpful! thanks in advance!
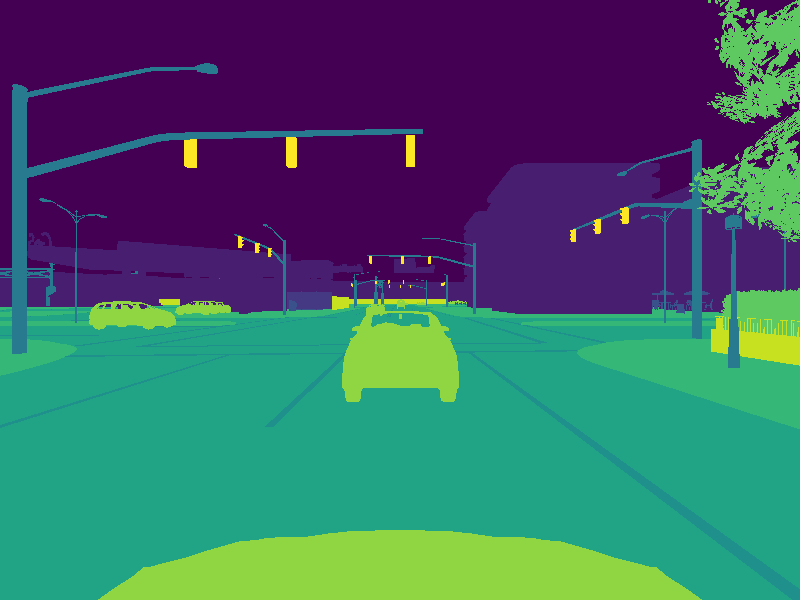
There is only one point I´m not happy about. I noticed that ImageSegmentationMask.show() function sometimes switch the color palette. I checked the mask arrays, and they have exactly the same codes, so it seems that this is not an issue with my dataset but with the plot function used. Does anyone know a way to fix that?
My audio project Manatee Chat first demo! Took me about a year to get here… It is still struggling with partial manatee calls, but it is getting better. It was trained on a small dataset and I did not use any transformations or augmentations yet (it will be the next step).
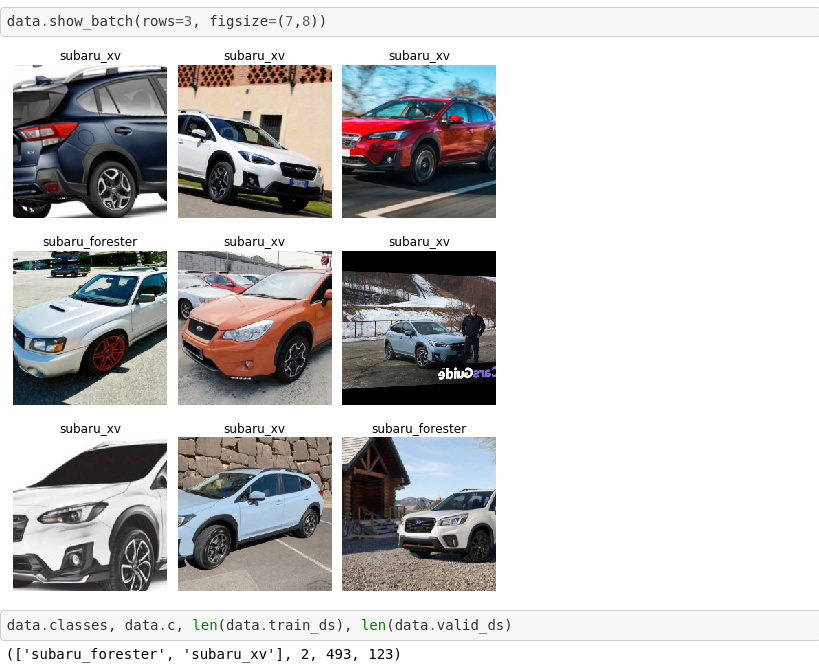
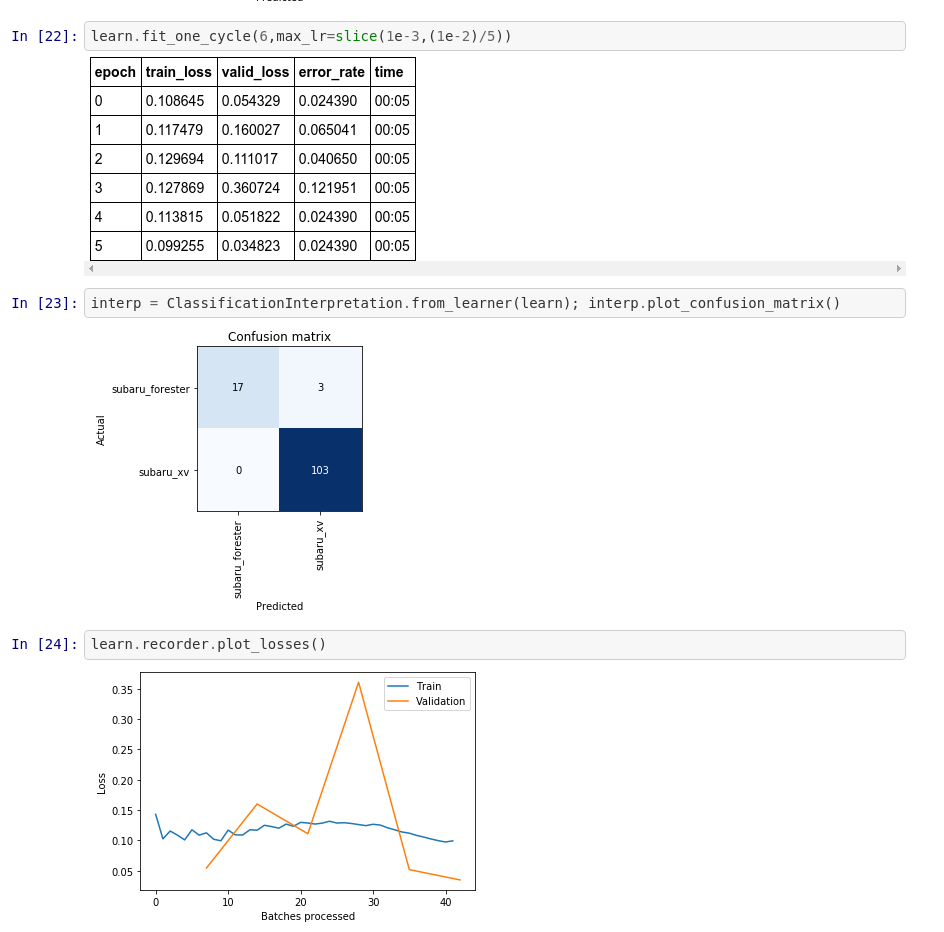
I started working through the first Lectures and wanted to share my initial project. As a Subaru fan, I wanted to create a classifier that distinguishes between two of the models, Forester and XV, which happen to look somewhat alike (being that one is a cross-over and the other a compact SUV). This and the fact that there are several generations of the models make the task at least mildly interesting/non-trivial. Here is a preview of the data:
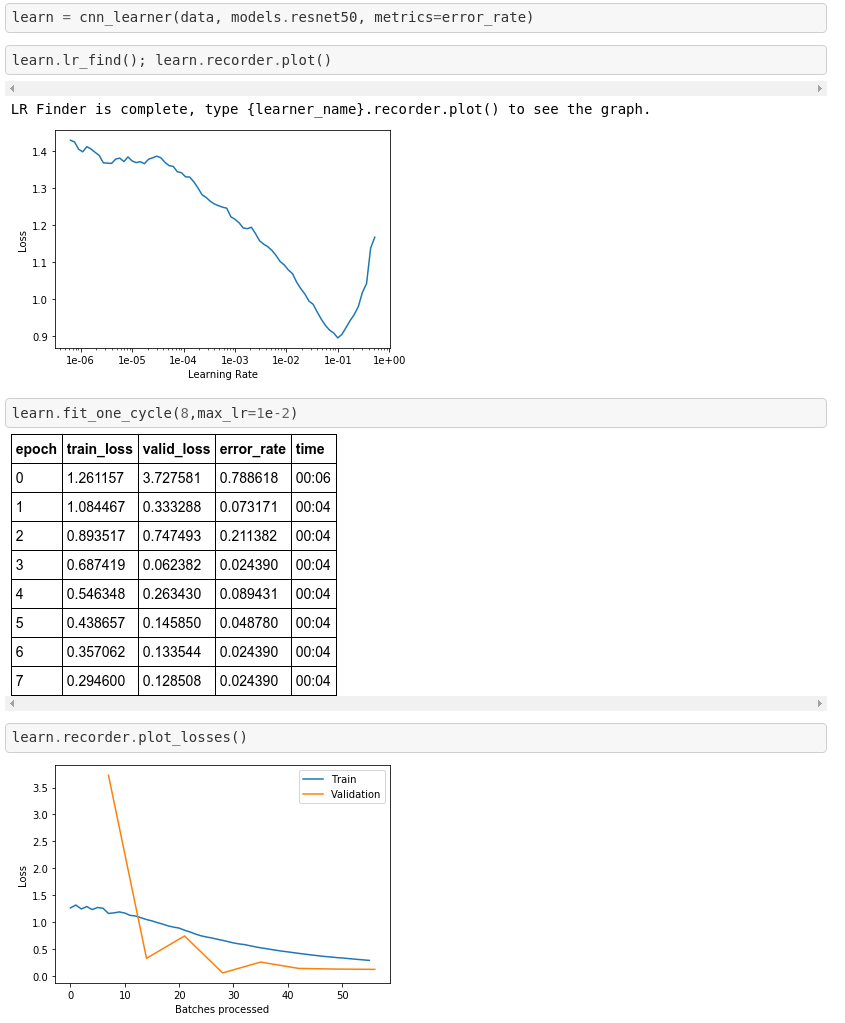
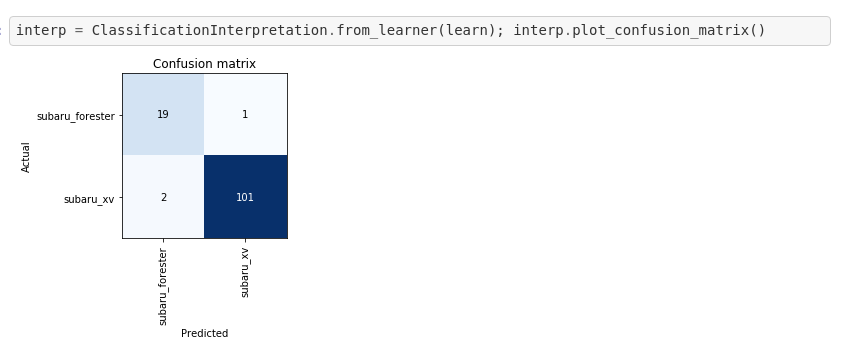
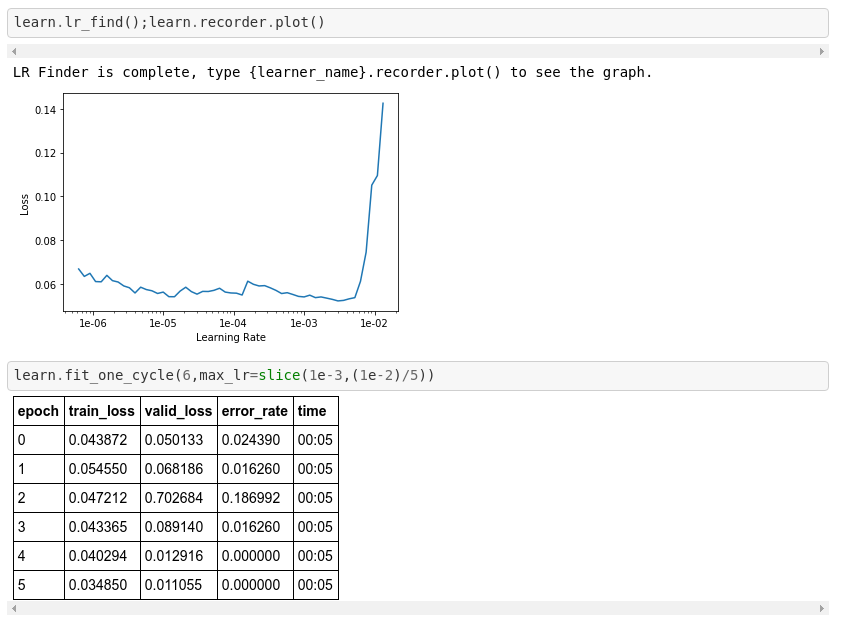
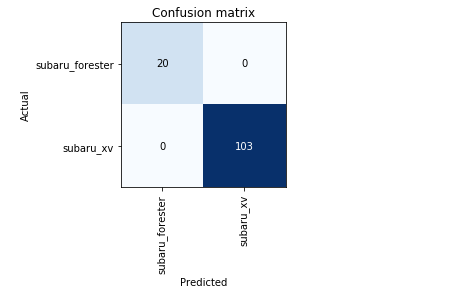
Now we seem to have ended up with a good set of weights So let’s see the confusion matrix … lol 3.Conclusion We were able to achieve an excellent solution thanks to transfer learning (using a ResNet50 architecture) and the incredible fastai library. Overall we had just 616 data points, which definitely contradicts the common belief that one needs a lot of data to successfully use Deep Learning in practice.
The full notebook and the data are available at: ClassifyingSubarus
I am looking forward to exploring further projects and getting more familiar with the inner workings of the library, thanks Jeremy and team for a great course and library!
Thank you! How interesting! This is what I am working on too (marine mammals mostly, whales, dolphins and manatees), first step is to identify calls, then to classify them and finally (hopefully) maybe use NLP models to search for underlying structure (like they tried with lost human languages i.e. Linear A or Voynich Manuscript.)
Thank you so much @jeremy for the heads up on this
Natalija, your work is amazing. I know a little bit about what goes into hosting a deep learning model, to be able to put an end to end example like this is really impressive.
I am however even more excited about your post above I think there would be a lot of overlap between our work and a lot of grounds to share I don’t want to hijack this thread even further, let me please send you a PM
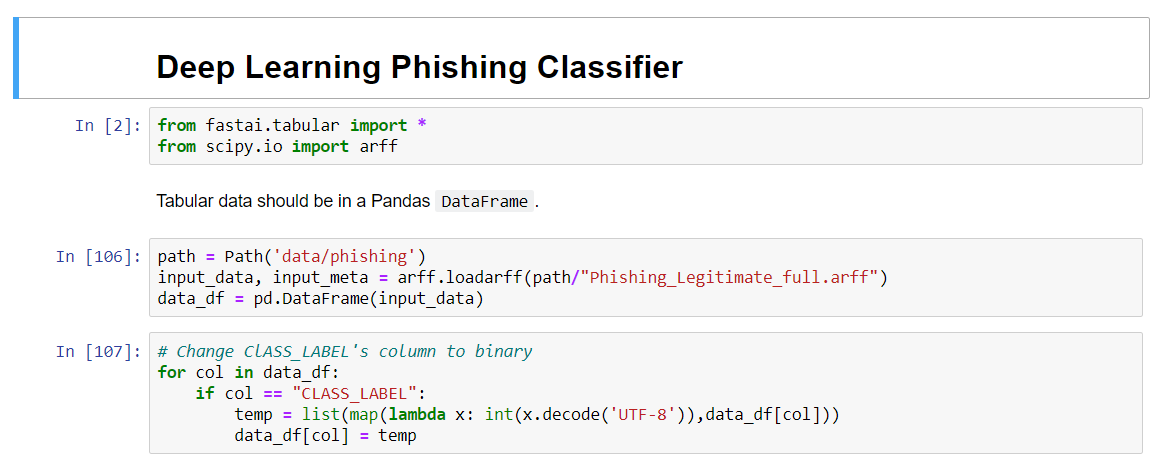
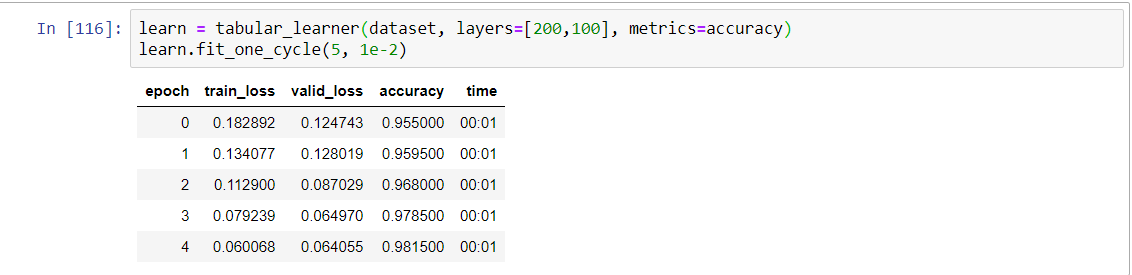
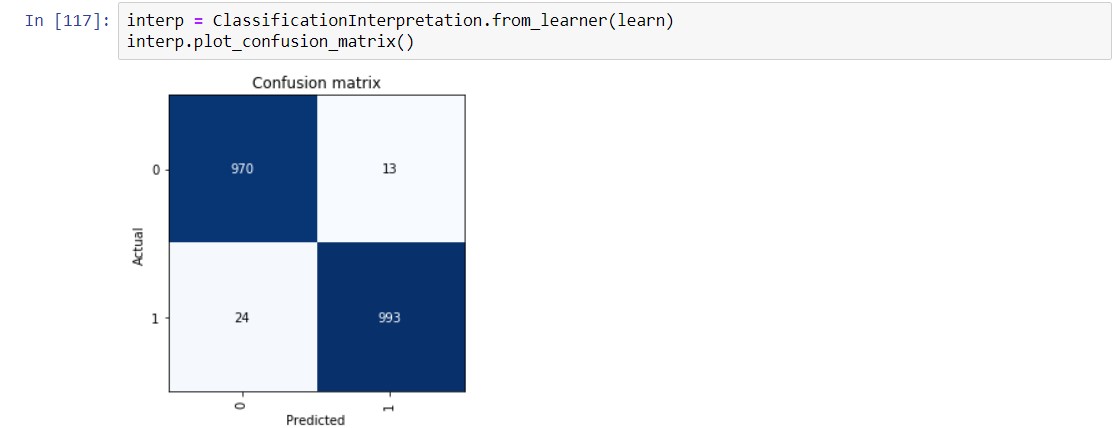
The dataset contains 48 features extracted from 5000 phishing webpages and 5000 legitimate webpages.
I obtained 98% of accuracy, outperforming benchmarks obtained with traditional ML algorithms used for phishing detection like Random Forest, SVM. For instance, the related paper to the dataset says: " The overall experimental results suggest that HEFS performs best when it is integrated with Random Forest classifier, where the baseline features correctly distinguish 94.6% of phishing and legitimate websites using only 20.8% of the original features."https://www.sciencedirect.com/science/article/pii/S0020025519300763#ec-research-data
So, like @jeremy said in the 4th lesson: "It’s not true that neural nets are not useful for tabular data ,in fact they are extremely useful. "
Part 1: Lesson 1 - Adventures
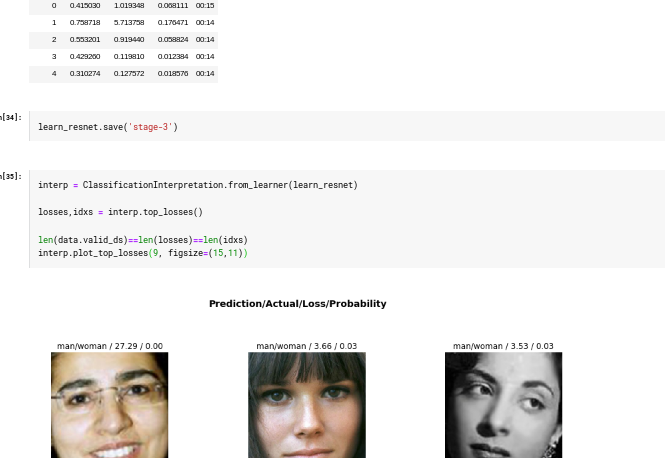
I used 1675 images of men and women and built a model to predict man vs woman. I good pretty good results. Here’s my work:
I am so positive this was a ton of work, but if you get around to sharing your source code. I would love to learn how you approached this problem outside what Jeremy taught on the Rossman data set.
If not maybe explaining did you tweak the architecture?
Hello Jeremy, in fact it wasn’t. I used the tabular notebook from the class. I added a few lines mostly to pre process the dataset and used the one cycle policy.
I was going to share the notebook in a github repository, but I had to leave home.
Awesome I have seen some amazing things happening with the fastai tabular framework. A winning solution for one of the kaggle competition that used k-folds and haven’t been able to completely go through that frame work, but it’s on my list.
I have worked with the tabular model and used the embedding to get better results with a random Forest, but look forward to being able to see your approach. I still think there is so much value in tabular data. Even thought nlp is what fascinates me the most.
Best Regards I’ll be back Monday night to see if you were able to upload thanks a million
 It is still struggling with partial manatee calls, but it is getting better. It was trained on a small dataset and I did not use any transformations or augmentations yet (it will be the next step).