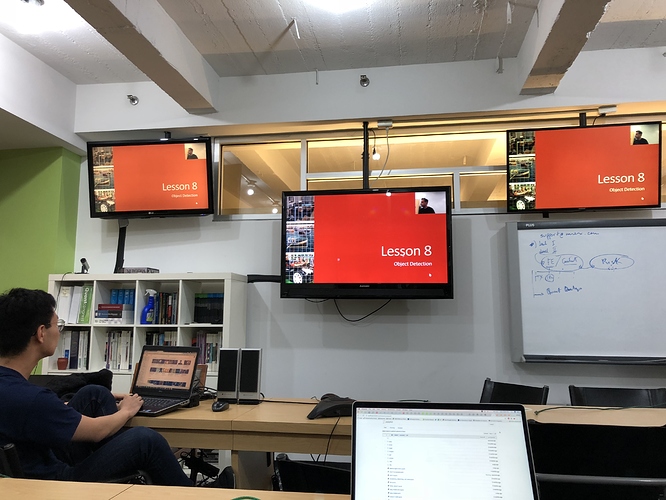
Lesson resources:
- Lesson video
- Notebooks and ppt both in
dl2folder in fastai github - Lesson notes from @hiromi
- Lesson notes from @timlee
Tips:
- Quick summary of how to download the dataset:
 cd ~/fastai/courses/dl2
 ln -s ~/data data && cd $_
 mkdir pascal && cd $_
 curl -OL http://pjreddie.com/media/files/VOCtrainval_06-Nov-2007.tar
 curl -OL https://storage.googleapis.com/coco-dataset/external/PASCAL_VOC.zip
 tar -xf VOCtrainval_06-Nov-2007.tar
 unzip PASCAL_VOC.zip
 mv PASCAL_VOC/*.json .
 rmdir PASCAL_VOC
- Login to AWS and get your public IP (xx.xx.xx.xx). Then, follow commands:
ssh ubuntu@xx.xx.xx.xx -L8888:localhost:8888
git pull
conda env update
jupyter notebook
- For PyCharm and Mac users - a list of the shortcuts Jeremy provided for Visual Studio Code:
- Action (PyCharm + Mac shortcut)
- Command palette- (
Shift + Command + A) - Select interpreter (for fastai env) - (Shift+Command+A) and then look for “interpreter”
- Select terminal shell- (
Shift+Command+A) and then look for “terminal shell” - Go to symbol (
Option + Command + O) - Find references (
Command+ G)(go down in the references) (Command + Shift + G) (go up)(Command + Function + F7) (look for all) - Go to definition (
Command + Down Arrow Key) - Go back (
Command + [) - View documentation (
Option + Space) for viewing source and (Function + F1) for viewing documentation - Zen mode (
Control + Command + F) and same to get out too - Hide sidebar
(Command + 1) redoing it will bring it back - Find them all with the (
Shift + Command+ A) palette option for reference.
Time line for videos
- (0:00:01) Part1, Part 2
- (0:00:45) Object Detection and why
- (0:02:00) Differentiable programming
- (0:03:22) Transfer learning
- (0:05:15) Architectures
- (0:06:28) Avoid overfitting
- (0:07:48) Embeddings
- (0:08:50) From Part 1 to Part 2
- (0:14:18) How to use provided notebooks at http://wiki.fast.ai/index.php/How_to_use_the_Provided_Notebooks
- (0:16:50) Build your own box
- (0:21:35) Start reading papers
- (0:25:30) Opportunities in the class
- (0:28:40) Writing blogs
- (0:30:15) what we’ll study in Part 2 - Generative models
- (0:35:10) Break
- (0:35:30) Object detection - bounding boxes
- (0:38:35) Step 1 of object detection
- (0:40:15) Pascal notebook & about the dataset
- (0:42:48) Python 3 PATH
- (0:47:38) Json data
- (0:49:18) bounding box annotations
- (0:50:30) pre processing
- (0:51:20) attitude working with deep learning
- (0:53:48) pre processing
- (0:55:05) defaultdict
- (0:56:19) variable naming
- (0:59:55) rows by columns, width height for bounding box
- (1:00:38) view inconsistencies
- (1:02:20) showing bounding box
- (1:03:15) finding about code
- (1:04:55) Visual studio code
- (1:11:00) open_image open cv library cv2
- (1:14:50) matplotlib OO
- (1:18:30) matplotlib set path effects, make box
- (1:23:00) largest item classifier
- (1:23:40) incremental solutions rather than bigger solutions
- (1:29:00) create csv for classifier
- (1:30:45) Transforms - squishing instead of cropping
- (1:33:15) data loaders
- (1:35:45) show_img command, data shape, normalize, denormalize
- (1:38:55) scheduler graphs
- (1:43:10) debugger
- (1:49:10) debugger colored
- (1:49:30) Interesting projects
- (1:50:26) Debugger stacktraces
- (1:52:55) bounding box model thought process
- (1:55:25) make multi output regression neural network
- (1:57:00) custom head fast ai
- (2:00:50) Goal of week - learn about matplotlib plotting and learn about bounding boxes
Resources related to stuff that Jermey mentioned we can learn/Homework
- Python debugger (pdb cheat sheet):
- You can use the python debugger pdb to step through code:
- pdb.set_trace() to set a breakpoint
- %debug magic to trace an error
- Commands you need to know:
- s - step: execute and step into function
- n - next: execute current line
- c - continue: continue execution until next breakpoint
- u - up: move one level up in the stack trace
- d - down: move one level down in the stack trace
- p - print: print variable, example: “p x” prints variable x
- l - list: lists 11 lines of code around the current line
- You can use the python debugger pdb to step through code:
- Alternative debugger that is more easy to use (https://github.com/pixiedust/pixiedust)
It’s more intuitive than the recommended by the course, But it’s still in developing phase.- Demo of debugger: https://www.youtube.com/watch?v=FoOHFlkCaXI
- Install:
pip install pixiedust - Import in top of the juputer notebook:
import pixiedust
*In the top of the cell you like to debugg, type:%%pixie_debuggerand run the cell. - Use the interactive buttons to step your code even outside of the jupyter notebook.
- OO Matplotlib
- Learn Greek letters / List of mathematical symbols at Wikipedia
- Editor
- If you don’t have a editor download one - PyCharm is free, Visual Studio Code is free
- Spend some time understanding navigating code in editor of your choice.
- Editor Shortcuts PyCharm
- VS Code keyboard shortcuts PDFs for Windows and MacOS
- Getting Started with Python in VS Code
- Jupyter Lab video
Others:
- Lesson summary by @avinash3593
- Python Plotting With Matplotlib
- Detexify - capture hand-written symbols
- a Neural Network in Your Browser
- What exactly is Transfer Learning?
- Bounding Box annotation tools
- Titan X Performance: PCI-E 3.0 x8 vs x16
This is a wiki thread - feel free to add links to resources covered in, or relevant to, the lesson. If you have questions or comments during class, add them below.

