is there a way to get the coordinates of any of those identified segments ?.
1 Like
Remember MSE is mean squared error. So take sqrt to get something more interpretable. Although you may want to use L1 loss as the loss_func or a metric since that’s easier to understand.
1 Like
I wrote a post summarizing Jeremy’s interview with deep learning researcher Leslie Smith last week:
I discuss:
- What propelled Leslie down the path toward creating the one-cycle policy.
- Leslie’s current research direction.
- Why Leslie’s previous research is useful to me as a practitioner.
- Why Leslie’s journey is personally meaningful to me.
Thanks for checking it out,
-James
10 Likes
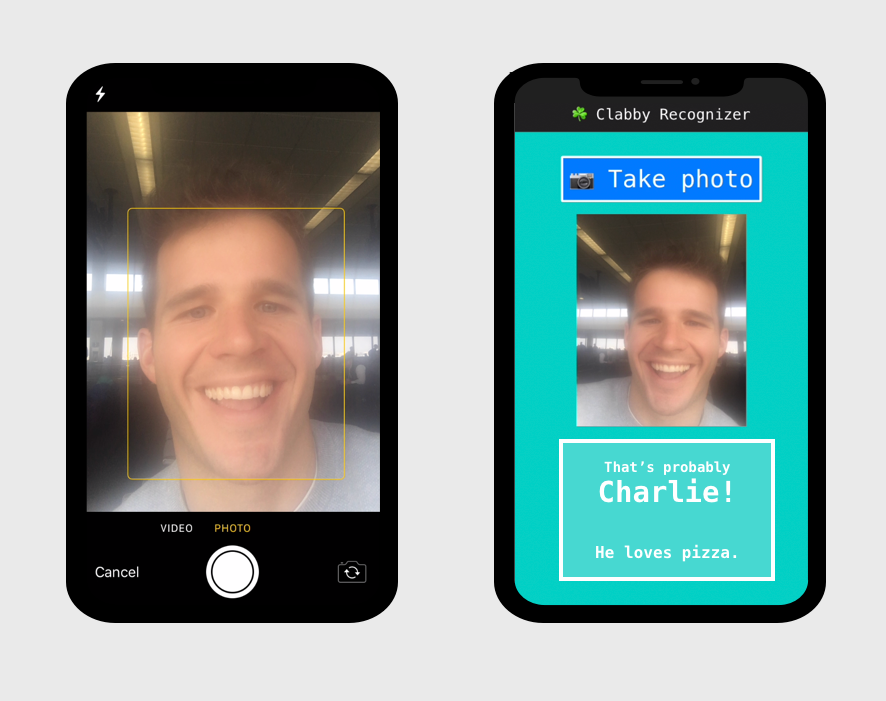
I wrote a blog post about my Thanksgiving Cousin Classifier if you want to check it out!
8 Likes
Nice!
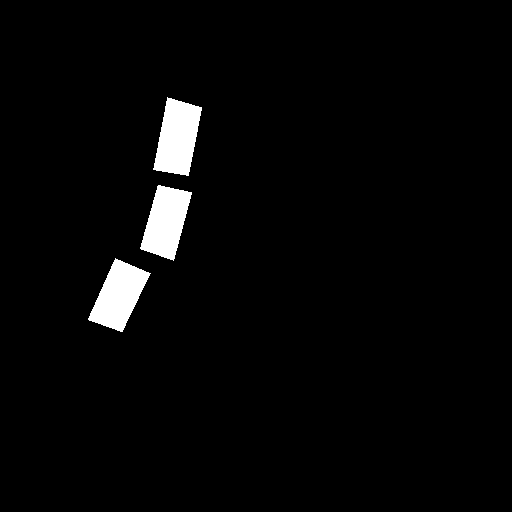
Yes we can. Thresholding, polygonizing, & geo-referencing predicted segments will be the focus of a future notebook.
The short version is that I’m following a Slippy Map tile name convention used by OpenStreetMap and other web maps which enables easy conversion from tiles to lat/lon coordinates and back.
For example:
Each image & corresponding mask in my segmentation dataset has a filename that starts like “grid_001_19_319363_270514_…”:
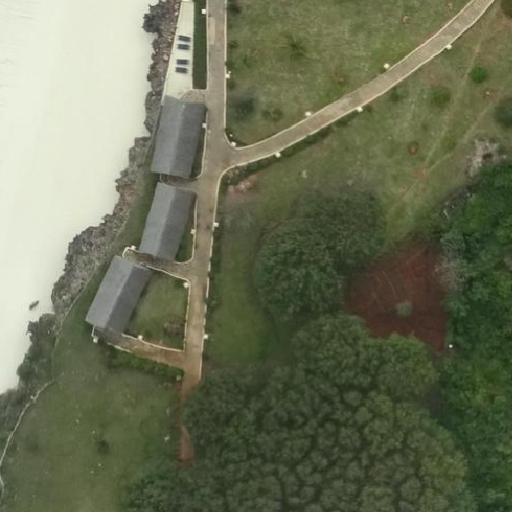
After “grid_001_”, the numbers correspond to {zoom}_{xtile}_{ytile} information. So in this case, we can use the provided num2deg() conversion function to get the NW corner longitude & latitude for this particular time:
# https://wiki.openstreetmap.org/wiki/Slippy_map_tilenames#Python

import math
def num2deg(xtile, ytile, zoom):
    n = 2.0 ** zoom
    lon_deg = xtile / n * 360.0 - 180.0
    lat_rad = math.atan(math.sinh(math.pi * (1 - 2 * ytile / n)))
    lat_deg = math.degrees(lat_rad)
    return (lat_deg, lon_deg)

zoom = 19
xtile = 319363
ytile = 270514

lat, lon = num2deg(xtile, ytile, zoom)
lat, lon
(-5.737609279566592, 39.28916931152344)
Putting this into Google Maps or OpenStreetMap will bring you to that tile’s NW corner location at that zoom level: https://www.openstreetmap.org/#map=19/-5.73761/39.28917
Doing this for all 4 corners of the tile gives you the geo bounds of that tile.
To assign lon/lat coordinates to detected buildings, we have to match up the display (x, y) coordinates of predicted pixels relative to the lon/lat bounds of that tile. This would happen during the polygonizing step. Too much detail to go into that here (and it’s not really specific to deep learning) so stay tuned for that notebook.
If there’s interest, I can also start a new wiki thread for us to share know-how, applications, and new ideas on geospatial deep learning. I’m learning too (aka fumbling my way into making things work) and I’m sure there are many sources of experience & wisdom among us to share and build on!
11 Likes
That would be great!
4 Likes
I created a notebook to explore visual representations of embeddings.
https://www.kaggle.com/tamlyn/animating-embedding-space
Using a toy problem I created an embedding layer with three dimensions then animated them on a 3D scatter plot. It’s interesting to see how they gradually move from random positions into some kind of order. I just wish I could keep adding dimensions :hypercube:
Please share if you fork the notebook and do something cool, I think there’s lots more that can be done with this.
5 Likes
Thanks, feel free to grab the updated HTML templates from the repo for your project 
3 Likes
Hi, etown
I uploaded the notebook to github: https://github.com/flaviorainhoavila/IEMOCAPspeechEmotionRecognition
I borrowed the audio-spectrogram conversion from https://dzlab.github.io/jekyll/update/2018/11/13/audio-classification/
In order to run the nobeook you’d need to request the data from https://sail.usc.edu/iemocap/
Cheers
3 Likes
Done! https://forums.fast.ai/t/geospatial-deep-learning-resources-study-group/31044
Could you please wikify that post when you have the chance?
2 Likes
I’ve belatedly added the training notebook behind my car classifier app http://whatcar.xyz.
The only real trick I used was to sample an equal number of images from each class, and resampling between fits.
Even though I got 80% accuracy in validation, I only got around 50% in the real world. One reason for this is my photos are different to professionally taken photos from the internet (lighting, obstructions, etc), another is that not all cars are equally likely to be seen. Something to keep in mind if your production data is going to be different to your training data.
Hi fellow course-mates and @jeremy ,
Has anyone seen this weird error while running Jeremy’s Collab nb? I updated all of the packages before running the notebook, but it still gives this error.
---------------------------------------------------------------------------
NameError                                 Traceback (most recent call last)
<ipython-input-4-86fc5648604f> in <module>
----> 1 data = CollabDataBunch.from_df(ratings, seed=42)

NameError: name 'CollabDataBunch' is not defined
awesome
Hi @avinashj,
thanks for the compliment! I actually did work a bit further on the project, specifically on the leaves from the category “NaturalBackground” which would be similar to your dataset.
My idea is to use the model I trained on the “SheetAsBackground” data with fastai and apply transfer learning to it, in order to train the model with the “NaturalBackground” images.
This seems not to work out of the box with fast.ai, as there are not 124 classes but instead 51 classes in the new dataset. I found a way to solve this problem with the help of @PierreO, see how it is done here.
I guess you could take my model and use transfer learning with your own dataset. Let me know how it goes!
Thanks for the detailed explanation and the notebook. Yes, that was what I was thinking of.
I along with my friends trying to come up with a model to identify native Indian plants which will be helpful for ecologist working in India.
I’ll post here once I proceed further with my work.
Regards
1 Like
@sparalic I think you should simply re-run the cell where you have from fastai.collab import * to import everything in there including CollabDataBunch.
Thank you @bachir, but it seems like my symlinks are all messed up so my nb was not pulling the fastai modules from the correct path. Unfortunately, I went around it using the annoying sys.path.append('../fastai') trick.
I wrote a few words answering the questions “what are pretrained models?” In some sense, I have taken pretrained models for granted to the point where when someone asked me what they were, I miserably stumbled.
I am not sure this can be very useful to anyone taking this course but having been asked the question made me realize that hey, probably for people who have not taken this course or who are not planning to write code but would be interested in learning about the field, this could be quite helpful.
Anyhow, there is also a bit of chewbacca vs yoda classification going on and again I am amazed at how much one can do with the fastai library with so little code!
https://radekosmulski.github.io/answers/html/What%20are%20pretrained%20models%3F.html
7 Likes
Do you use a plain Jupyter notebook’s HTML as a post? Or does it require some additional rendering libs?