kaggle is another system for ‘experiment tracking’ in a way. when you save and run all (commit) it will save notebook with outputs, input data, output data under a version, so you can come back and recheck
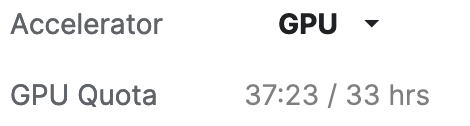
btw, just noticed when you run out of gpu quota on kaggle and have like minutes left in your weekly quota, you can still start the save and run all and get additional time (up to 9 hours - kernel run time) .
Regarding finding out about processes that are holding a port (say, 8889), I use this:
On Linux:
netstat -ano | grep 8889
On macOS, there is no -o option, but -v can be used. We’re trying to get it to list the port numbers.
netstat -van | grep 8889
If you don’t know the port you can also grep for a substring in the process name to filter out just the lines containing that substring. (e.g., grep python or grep -i jupyter note that the -i option makes the grep case insensitive.)
P.S. On a paperspace instance you’ll need to install netstat first. On some systems you may need to use sudo depending on how locked down the network binaries are on a given system
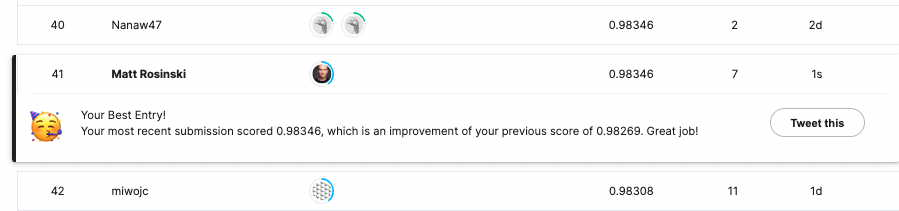
Oh wow, Sarada, this is wonderful! My first ever Kaggle Notebook gold! Earned with the help of our amazing community! It couldn’t get better than this!
Thank you so very much for making this happen and my heartfelt thank you to everyone who contributed their votes
And thank you so much for your very kind words! I continue to learn a lot from everyone here. It was wonderful to see you today in the walk-through today, Sarada!!!
BTW what surprises me quite a bit is the number of medals in discussions. I can barely remember talking online that much But oh well, if there is a record to prove it, I guess it must have happened
Thank you so very much again everyone for this wonderful surprise!
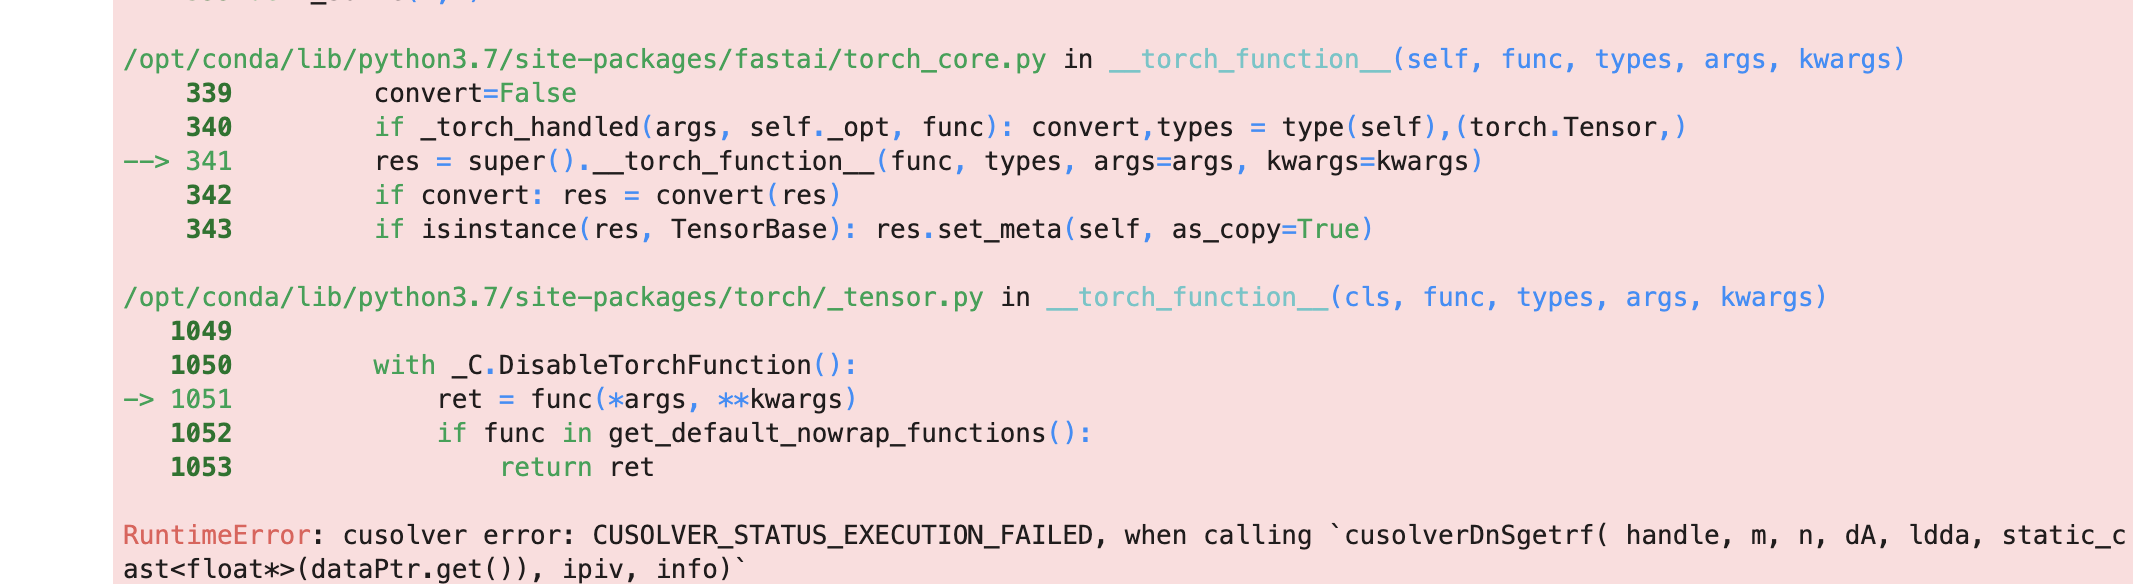
Something peculiar I noticed on Paperspace today is that I was getting a very long error when creating the data loader with the same exact code that worked on a different machine yesterday.
I tried restarting the kernel but got the same error. Then I stopped the machine (P5000) and started a new RTX4000 machine and ran the same exact notebook and the same code ran without error. No idea why but seems there a problem somewhere.
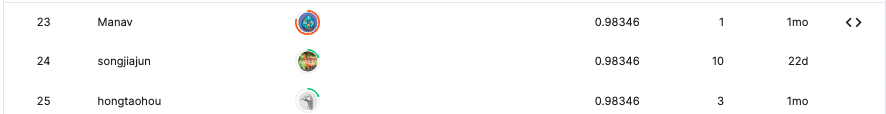
The time here could be of the last submission which not necessarily is the best one i think…
Edit: i meant that if you submit a solution kaggle records a time of it, if it’s your the best scoe, the score and hopefully position gets updated on leaderboard. However if score is lower than best, only submission time is recorded.
Ok, I had the same on my local computer. Could you check my full trace and compare it to yours?
Mine disappears when I run the same line again. It is weird.
Is there are generally accepted description for the type of multiple target model you started to build today Jeremy? It’s not multi-modal because we are only using images for training. Would this be correctly referred to as a multi-head model?
How can we get the sweep ids from the wandb experimentation? I’m running sweep.py to generate the data for the analysis.py as Jeremy did. I don’t know how to construct the sweep id for creating dictionaries for the dataframe? Any hint? Thanks.
I really like using the lsof command for this category of issues.
lsof -i :4321 # gets the process that "opened" the port number 4321
Pretty handy with hunting down (process that) occupied local ports, locked/opened files etc., lsof (list open files) does a lot more & is included with most distros.