GPU Optimizations Central

This thread is for discussing tools and techniques for getting the most out of your GPU. Please discuss your ideas and discoveries in the posts below.

This first wiki post is to compile a list of useful tools and tutorials on this topic. Please edit and add other goodies.

Tools

Discussions

Text-specific

Tutorials

15 Likes

A post was merged into an existing topic: IPyGPULogger: GPU Logger for jupyter/ipython memory usage and exec time

Awesome. Thanks @stas (also for ipyexperiments)!

1 Like

What would be a good workaround (current version of fastai) to avoid issues like kernel death or buffer truncation while running a language model learner training (n epochs)? The model uses 28m tokens and 30k vocab. I am using @piotr.czapla 's ULMFiT work but the bottleneck is in the fit_one_cycle. Since the first few epochs are completed successfully, should gpu memory be reclaimed between epochs? I am not that expert in coding.

I’m still working through the vision class and have been getting seriously sidetracked by the need to develop new tools to support this kind of investigation (see the new ipygpulogger ).

But @Kaspar is working on the text classes already, join his efforts here: Optimising class LanguageModelLoader()

Since the first few epochs are completed successfully, should gpu memory be reclaimed between epochs? I am not that expert in coding.

It should be the case. Do you observe the same “leak” if you run several 1 epoch fit_one_cycle? I know it’d impact the results, but at this moment we are just talking about the memory usage. Use ipygpulogger , to make it easy to trace memory.

It’d be handy to instrument fit_one_cycle to report memory usage after each epoch.

Has there been any significant changes in the core code running the model recently? Because earlier when I ran this language model code, a single epoch ran in over 2 hours and there was 96% GPU utilization most of the time. This was about 20 days ago. However, when I run the same code now, I can barely get 70% GPU utilization and the same code for one epoch takes over 12 hours.

You’re making a good point that we should probably have some timing tests to catch any potential regressions in speed. Otherwise there is no telling.

It sounds that perhaps your transforms struggle at feeding the gpu fast enough? check your cpu/ram utilization/availability?

You guys should put your efforts together over at this thread: Optimising class LanguageModelLoader()

Here’s an experiment I ran on colab (not sure if ipyexperiments take into account how colab allocates gpu RAM):

*** Experiment started with the Pytorch backend
Device: ID 0, Tesla K80 (11.2 GB RAM)

*** Current state:
RAM:   Used      Free     Total    Util
CPU:   1.7 GB   10.9 GB  12.7 GB  15.76% 
GPU: 327.0 MB   10.9 GB  11.2 GB   2.94% 
import pretrain_lm
expm = pretrain_lm.LMHyperParams(dataset_path='/content/data/ar28/', 
                                base_lm_path=None, bidir=True, 
                                qrnn=False, tokenizer='v', max_vocab=32000, 
                                emb_sz=400, nh=1150, nl=3, clip=0.20, 
                                bptt=64, lang='ar', name='Arabic')
learn = expm.train_lm(num_epochs=1, bs=64, drop_mult=0.3, lr=5e-3)
[crashes with cuda OOM error, ran successfully with bs = 32]
*** Experiment finished in 00:01:17 (elapsed wallclock time)

*** Local variables:
Deleted: expm, pretrain_lm

*** Experiment memory:
RAM:  Consumed     Reclaimed
CPU:   1.6 GB    0.0 B (  0.00%)
GPU:  10.1 GB   1.4 GB ( 14.33%)

*** Current state:
RAM:   Used      Free     Total    Util
CPU:   3.3 GB   10.4 GB  12.7 GB  32.02% 
GPU:   9.0 GB    2.2 GB  11.2 GB 410.81% 

The corpus size is around 28m tokens. Is it feasible that 10 gb were consumed and could not run the cell? Or maybe the experiment is not reading colab’s allocation policies correctly? What’s an approximate gpu memory cost for this process? I think 10gb is too much.
Edit: I ran the same test on Kaggle and here are the results (cuda OOM for same parameters above.

*** Experiment started with the Pytorch backend
Device: ID 0, Tesla K80 (11.2 GB RAM)

*** Current state:
RAM:   Used      Free     Total    Util
CPU:   1.8 GB   13.2 GB  15.7 GB  13.30% 
GPU: 327.0 MB   10.9 GB  11.2 GB   2.94% 
[OOM process]
*** Experiment finished in 00:02:10 (elapsed wallclock time)

*** Local variables:
Deleted: expm, pretrain_lm

*** Experiment memory:
RAM:  Consumed     Reclaimed
CPU:   3.2 GB    0.0 B (  0.00%)
GPU:  10.1 GB   1.4 GB ( 14.35%)

*** Current state:
RAM:   Used      Free     Total    Util
CPU:   4.9 GB   10.0 GB  15.7 GB  49.07% 
GPU:   9.0 GB    2.2 GB  11.2 GB 408.40%

I will only comment on ipyexperiments, and let others comment on the actual problem, since I haven’t delved into text yet.

So as you can see, comparing reports on different systems, the reported numbers are correct, ipyexperiments doesn’t do anything special, just measuring the reported by the system memory before and after. I’m going to switch the general RAM calculation to use tracemalloc, since it overcomes the issue of python internal caching.

And I see there is a bug in Util calculation, will fix shortly.

Also, you need to be aware of the peak memory, at the moment use ipygpulogger for that purpose. If peak memory is more than final consumed memory you may or may not have enough of RAM to support it. I wonder whether ipyexperiments needs to report that too. Have a look at ipygpulogger and see its numbers.

OK, observing closer, ipyexperiments is not deleting learn, because you must have had it defined before the experiment started. Unfortunately, ipyexperiments can only detect new variables, see: GitHub - stas00/ipyexperiments: Automatic GPU+CPU memory profiling, re-use and memory leaks detection using jupyter/ipython experiment containers
That’s why it’s not reclaiming the memory. If someone has ideas on how to overcome this problem I’m all ears.

So, please try again, using unique variables for the experiment, or del learn before you start the experiment.

Actually, learn here is the return value of the function train_lm (https://github.com/n-waves/ulmfit-multilingual/blob/master/ulmfit/pretrain_lm.py#L149).

Actually, learn here is the return value of the function train_lm

And as said earlier you need to get it deleted, it holds most of the occupied memory. So perhaps simply rename it to:

learn1 = expm.train_lm(num_epochs=1, bs=64, drop_mult=0.3, lr=5e-3)

so that ipyexperiments can delete it automatically. or delete it manually before the experiment is over.

1 Like

In the case reported above, the process dies (cuda OOM), so there may not be a learn object in this case.

I see, yes, then it probably never gets assigned no, and in which case the temp object would get destroyed and gc.collected() via ipyexperiments. As I suggested, start using ipygpulogger, split each call into its own cell and then you can easily trace the memory consumption of each invocation separately.

Usually, what works well is first creating the learn object, and then doing the training, so that if you hit OOM, then deleting it does reclaim a lot of memory.

Here is a memory profiler that taps into each epoch, and can be fine-tuned to each separate stage.

import tracemalloc, threading, torch, time, pynvml
from fastai.utils.mem import *
from fastai.vision import *

if not torch.cuda.is_available(): raise Exception("pytorch is required")

def preload_pytorch():
    torch.ones((1, 1)).cuda()
    
def gpu_mem_get_used_no_cache():
    torch.cuda.empty_cache()
    return gpu_mem_get().used

def gpu_mem_used_get_fast(gpu_handle):
    info = pynvml.nvmlDeviceGetMemoryInfo(gpu_handle)
    return int(info.used/2**20)

preload_pytorch()
pynvml.nvmlInit()

class PeakMemMetric(LearnerCallback):
    _order=-20 # Needs to run before the recorder

    def peak_monitor_start(self):
        self.peak_monitoring = True

        # start RAM tracing
        tracemalloc.start()

        # this thread samples RAM usage as long as the current epoch of the fit loop is running
        peak_monitor_thread = threading.Thread(target=self.peak_monitor_func)
        peak_monitor_thread.daemon = True
        peak_monitor_thread.start()
        
    def peak_monitor_stop(self):
        tracemalloc.stop()
        self.peak_monitoring = False
        
    def peak_monitor_func(self):
        self.gpu_mem_used_peak = -1

        gpu_id = torch.cuda.current_device()
        gpu_handle = pynvml.nvmlDeviceGetHandleByIndex(gpu_id)

        while True:
            gpu_mem_used = gpu_mem_used_get_fast(gpu_handle)
            self.gpu_mem_used_peak = max(gpu_mem_used, self.gpu_mem_used_peak)
            if not self.peak_monitoring: break
            time.sleep(0.001) # 1msec

    def on_train_begin(self, **kwargs):
        self.learn.recorder.add_metric_names(['cpu used',  'peak', 'gpu used',  'peak'])
                    
    def on_epoch_begin(self, **kwargs):
        self.peak_monitor_start()
        self.gpu_before = gpu_mem_get_used_no_cache()

    def on_epoch_end(self, **kwargs):
        cpu_current, cpu_peak =  list(map(lambda x: int(x/2**20), tracemalloc.get_traced_memory()))
        gpu_current = gpu_mem_get_used_no_cache() - self.gpu_before
        gpu_peak    = self.gpu_mem_used_peak      - self.gpu_before
        self.peak_monitor_stop()
        # The numbers are deltas in MBs (beginning of the epoch and the end)
        self.learn.recorder.add_metrics([cpu_current, cpu_peak, gpu_current, gpu_peak])
# against MNIST dataset
# assuming you already have data and model objects
learn = create_cnn(data, model, metrics=[accuracy], callback_fns=PeakMemMetric)
learn.fit_one_cycle(3, max_lr=1e-2)

gives:

Total time: 00:59
epoch	train_loss valid_loss accuracy cpu used peak gpu used peak
    1	0.325806   0.070334   0.978800	      0   2       80  6220
    2	0.093147   0.038905   0.987700	      0   2        2   914
    3	0.047818   0.027617   0.990600	      0   2        0   912

The numbers are deltas in MBs (beginning of the epoch and the end)

Note the huge surge of GPU RAM required on the first epoch

The measurements may require more thinking, but it’s a good start.

@AbuFadl, perhaps this will be helpful for your OOM debugging.

Thanks to @sgugger for helping me figure out the custom metrics.

3 Likes

really good initiative.
i am already dreaming about extra columns with timing metric for each phase of an epoch :slight_smile:

That should be trivial, see:

Let me know if you need help with creating it.

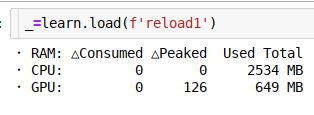
I may have found one source of GPU RAM fragmentation problem, which affects many due to fastai-MOOC recommending to make lots of checkpoints w/ learn.save()/load(), as each of them creates a hole in memory which is unlikely to be reused (if the size of the saved image grows from checkpoint to checkpoint - if it’s the same then it should be able to re-use the same fragment on subsequent loads).

At the moment I can’t see an easy way to remedy this on the fastai side, other than creating a checkpoint function that completely tears down the model from the learner object, removes it from CUDA and then reloads it.

Hopefully a proper solution can be implemented on the pytorch side. I started a thread here:

I also looked at the new shiny load_learner that @sgugger recently created, which is super-handy! perhaps a more elaborate version of load_learner can be created to perform checkpoints w/o creating fragmentation? But first let’s see what the pytorch devs have to suggest.

p.s. to understand how I found this issue, you can use ipyexperiments :

Here is the126MB GPU RAM overheard reported on resnet34/mnist, it should be close to 0.

screenshot

1 Like

This discussion helped me to understand that CUDA relocates free pages larger than 2MB and then re-uses them, so what I presumed to be a fragmentation scenario when the old model is not unloaded before the new one is loaded, is actually not the case.

It’s still a problem if you have only enough memory left to unload and then load the model, but if that’s the case once you load that model, you still have no memory left to do anything else, other than perhaps some extremely light inference.

So this basically was a false alarm and it’s no problem for the save/load model cycle to be inefficient memory allocation-wise (peak memory spike), it all gets balanced out on the subsequent calls to CUDA.

2 Likes

I added a new section to the gpu tutorial, so please feel free to contribute:
https://docs.fast.ai/tutorial.resources.html#todohelp-wanted

In particular this one would be very interesting to explore:

  • torch.utils.checkpoint can be used to use less GPU RAM by re-computing gradients. Here is a good in-depth article explaining this feature in tensorflow. We need pytorch/fastai examples. Contributions are welcome.

This one would be of a particular interest to someone who is struggling to fit their model into their GPU RAM, but don’t mind to wait a bit longer to recompute gradients more than once.

Thanks.

1 Like