Edit: I’m not sure if this is the right forum to post this!
Hi all,
I’ve taken a stab at Jeremy’s idea this morning about autoRLfinder.
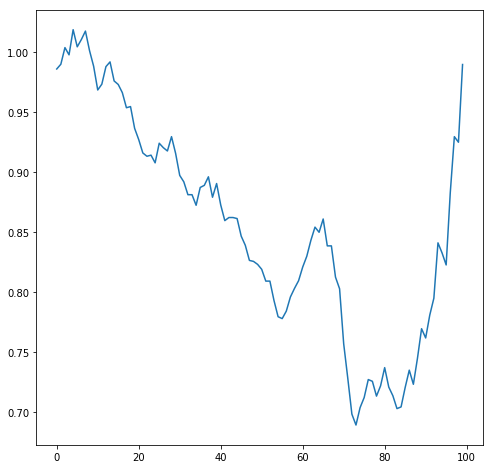
The output of LRfinder is a univariate time series, and as such can easily be transformed into an image, in a similar way to what I showed in a ‘Show your work’ post. The outcome of that experiment using transfer learning in a time series classification problem with only 30 train samples was really good, close to state of the art, and with only standard setting.
What I’ve done is the following:
Created a synthetic dataset roughly mimicking lr_finder outputs (time series)
Estimated a ‘recommended lr’ (this is a very, very bad approximation). I’ve just used to show the proposed methodology.
Padded time series data as they don’t all have the same length.
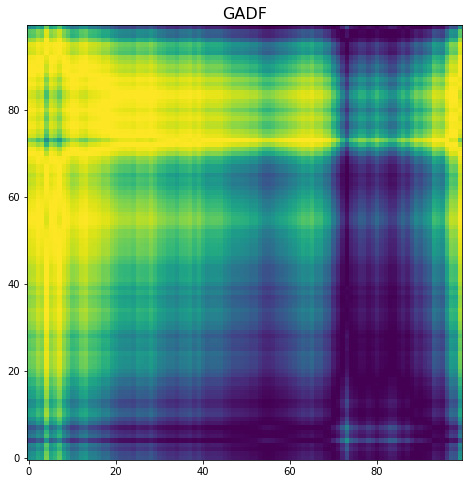
Transformed ts into images (this is based on a transformer that creates a rich representation of a univariate time series - paper), , for example:
Created a regression problem where the target is the log of the lr.
Train an model in the standard way (so far I have not been able to finalize this, as for some reason I keep getting an error. I’m still working on this)
The way I envision this working would be:
Run the lr_finder with an option to recommend a learning rate
Lr_finder would be run, and the model would predict a recommended lr when finished
I’m not too familiar with fastai library yet, and would need some help to get this working.
So if anybody find this interesting, and would like to collaborate, this is what would be required to complete the project:
Create a dataset with lr_finder curve values and ground truths.
Train the regression model
If the result is good, integrate it into the fastai code
I’ve created a gist with the work I’ve done so far.
I’ll be happy to hear:
If this is of interest to you
Feedback, ideas, recommendations on how to get what’s still missing
This is the key step. Getting people to contribute their LR finder results, along with what they found to be the best learning rate, would make it fairly easy (I’d guess) to automate the LR finding…
If there was some kind of “telemetry” for what has been done to models, this is the kind of thing that we could just ask people to turn it on and get data… Quite an interesting proposal, a machine learning lib fine-tuned with machine learning
On the other hand, there maybe an optimal analytical choice. AFAIK, besides Leslie N. Smith, and now the fastai community, there has not been a lot of research on superconvergence.
I just came up with this same idea and then I found your post. Very nice proposal!
It’s seems that there’s a lot of confusion among beginners about the procedure to follow in order to find an appropriate learning rate based on the output of LR finder, so I think it’s an interesting project. However, I also think more experienced people should be able to just look at those graphs and pick the right LR.
I agree with what Jeremy said in his reply to your post: it would be necessary that as many people as possible contribute to this project with their LR finder graphs along with learning rates that ultimately worked for their application.
What would be a good way to reach out to as many fast.ai students as possible?
Maybe creating a quick app with widgets and making it available inside notebooks as shown in lesson 2 could facilitate transferring the information from the users back to your project repo or something like that.
Hi Antoine,
Sorry for the late response.
To be honest with you, I don’t have much time, nor the technical skills (I’m not an IT person) to complete this. My intent with the post was just to share an idea on how an autoLRfinder could work.
I’d be happy to collaborate though provinding lr data, and ideas on time series data like this.
If you are willing to mode this forward, please don’t hesitate to take ownership of this. It seems we both came up with the same idea. I was just a bit faster typing it !
Please, don’t hesitate to contact me if need any help.
Thanks!
that sounds like a ‘cool’ solution. Wouldn’t there be a simple 1st step (with less than perfect results) to inspect the graph and find some solid long steep slopes towards the minima? Then one gives like e.g. 3 proposals. In this 1st step it would be more to make the reading exercise from plot easier, e.g in the plot function one could mark the proposed learning rates with a colour.
What you suggest would of course be better, but harder to implement.
I guess the right way would be to record it in the fit_one_cycle, which lr was used and then record the results. As far as I can see, one wouldn’t need an explicit GUI element and submit - one could just give a default parameter that users learning rate choices get recorded with results anonymised in the back end database. Maybe additionally one could ask the user after the recording, what worked best and ask them to classify in a UI widget.
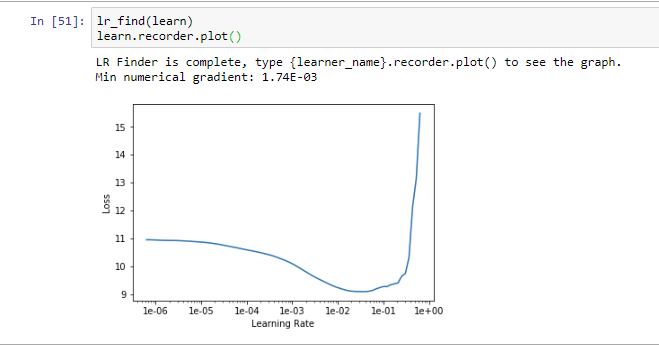
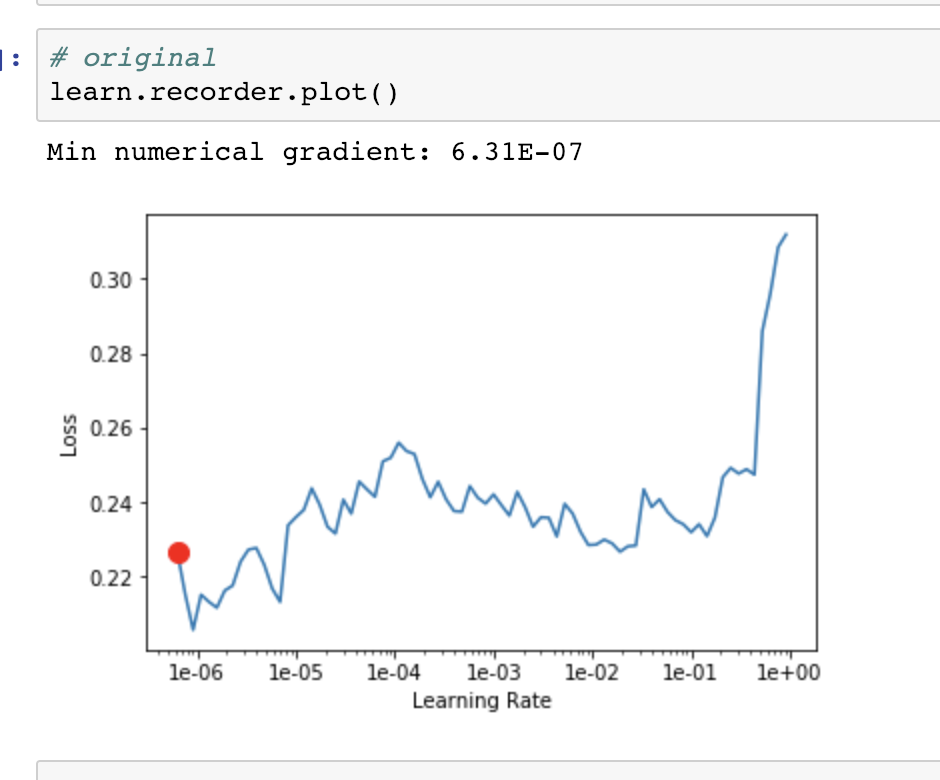
I am interested in an automated LR finder suggestion. As a start, can we just add the min gradient of the smoothed loss (it will not be perfect, but it will return something) Just two lines in basic_train.py
min_g_idx = (np.gradient(np.array([x.item() for x in losses]))).argmin()
print(f"Min numerical gradient: {lrs[min_g_idx]:.2E}")
That’s why it shouldn’t be fully trusted and the graph still shown. Maybe the printed message need to be more clear in saying it’s not always reliable.
I guess whoever folks are working on the automatic LRFinder, this would fit right in there, since you probably will have to figure it out anyway. And thank you!
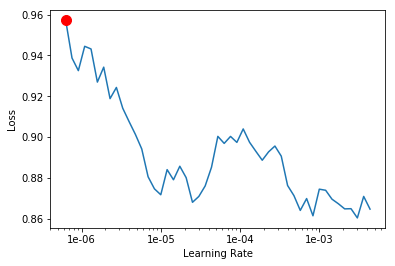
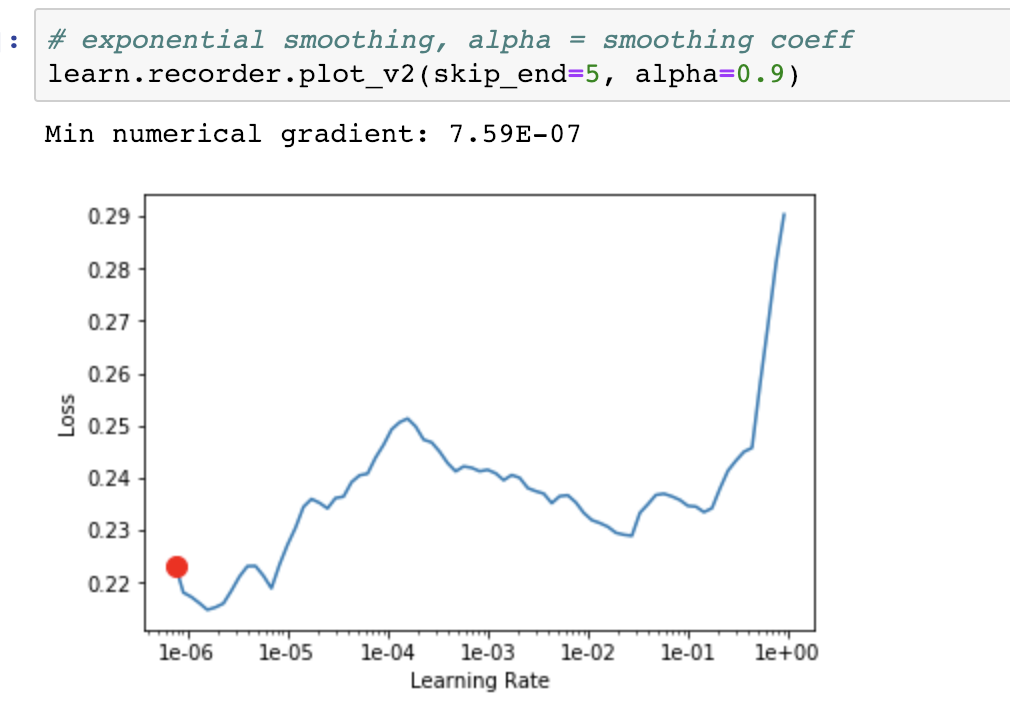
This behavior mostly happens during later stages of fine tuning in my experience where the plot is not as stable as if you were just starting training. Maybe further smoothing with an alpha input parameter on top of self.losses to create a tmp smoothed losses inside .plot() method might allow users to try couple of min numerical gradients?
I’ve reproduced the phenomena: started training - interrupted it - called lr_find
I would probably try more use cases (including yours) before considering a PR. I believe still manually observing the plot is the best approach but this may be helpful with running experiment scripts automatically. One tiny step closer to automl
Interesting! Please note that the version plotted is already the smoothened version of the loss (so it’s already an exponential moving average of the loss)
That’s correct and I was also thinking the same: are we loosing too much info by double smoothing/fittting or would it just be fine? Only way is probably to try it many times before considering for auto lr.
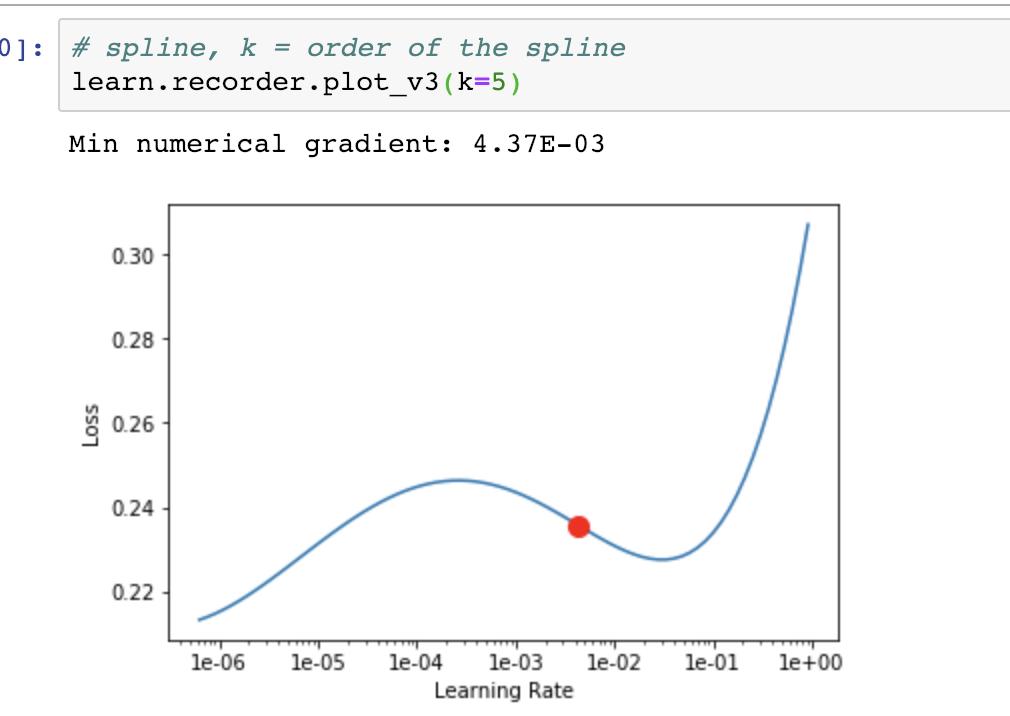
You should try the spline approach over the original set of points (the implementation of the lr finder has the problem of using a moving average to smooth the graph. This causes the resulting curve to be “late” wrt the real data).