Machine Learning Lecture 8
Aside: Know how to sell - will always be a part of everyone’s job : Be Noticed!
Moving from Decision Trees to Deep Learning
There are some situations, were RF will not perform as well. For the kaggle grocery competition, its difficult to get a good score with RFC. This is due to :
- high cardinality
- time series
- lots of data
What about recognizing digits?

1. Get the Data
Load libraries
%load_ext autoreload
%autoreload 2

from fastai.imports import *
from fastai.torch_imports import *
from fastai.io import *
Pull the saved data
URL='http://deeplearning.net/data/mnist/'
!wget http://deeplearning.net/data/mnist/
--2017-11-21 14:49:53--  http://deeplearning.net/data/mnist/
Resolving deeplearning.net... 132.204.26.28
Connecting to deeplearning.net|132.204.26.28|:80... connected.
HTTP request sent, awaiting response... 200 OK
Length: 935 [text/html]
Saving to: ‘index.html.1’

index.html.1        100%[===================>]     935  --.-KB/s    in 0s

2017-11-21 14:49:53 (89.2 MB/s) - ‘index.html.1’ saved [935/935]
path = './'
FILENAME='mnist.pkl.gz'
def load_mnist(filename):
    return pickle.load(gzip.open(filename, 'rb'), encoding='latin-1')
Pickle - python object saving / loading
Great for saving python objects. You can save everything, but is not always optimal. You can save dictionaries, lists, complex objects.
Feather - specific python dataframe saving / loading
Feather is specifically designed to save dataframes, to write and load fast
Deconstructing
If we know that a function will return a 2 item tuple, we can set a similar structure to capture the variables outside of the tuple as shown below.
def myfunc:
    return (2,3)

(a,b) = myfunc

a = 2 # no longer tuple
b = 3 # no longer tuple
get_data(URL+FILENAME, path+FILENAME)
((x, y), (x_valid, y_valid), _) = load_mnist(path+FILENAME)
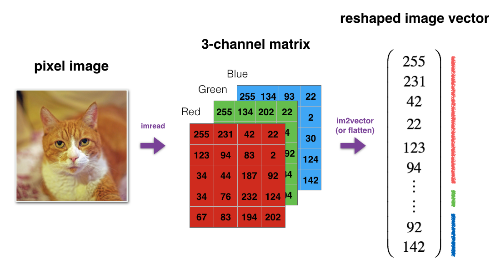
2. Data Normalization + Processing
Image size: 28 x 28
We also notice that the dimensions are too high, this is because of the way that the data is stored. We will need to extract.
Vocab:
Vector = 1d array = rank 1 tensor
Matrix = 2d array = rank 2 tensor
cube = 3d array = rank 3 tensor
If we take a look at the dimensions of the variables that we have loaded
type(x), x.shape, type(y), y.shape
(numpy.ndarray, (50000, 784), numpy.ndarray, (50000,))
Does normalization matter for random forests for independent variables ?
No, When we normalize, we only care about the order. This is also why random forests are resilient to outliers.
Does normalization matter for deep learning ?
Yes, because we are making a parameterized model.
Normalizing the entire dataset
mean = x.mean()
std = x.std()
x=(x-mean)/std
x.mean(), x.std()
(-3.1638146e-07, 0.99999934)
Normalize the Validation Set
Note that we are using the entire dataset mean and std to transform the validation set. This is to ensure standardized transformation between all datasets.
x_valid = (x_valid-mean)/std
x_valid.mean(), x_valid.std()
(-0.0058509219, 0.99243325)
Helper Methods for Plotting
Wrapping the matplotlib library for showing images to make our lives a bit easier
%matplotlib inline
import numpy as np
import matplotlib.pyplot as plt

def show(img, title=None):
    plt.imshow(img, interpolation='none', cmap="gray")
    if title is not None: plt.title(title)
def plots(ims, figsize=(12,6), rows=2, titles=None):
    f = plt.figure(figsize=figsize)
    cols = len(ims)//rows
    for i in range(len(ims)):
        sp = f.add_subplot(rows, cols, i+1)
        sp.axis('Off')
        if titles is not None: sp.set_title(titles[i], fontsize=16)
        plt.imshow(ims[i], interpolation='none', cmap='gray')
Remember that all the data is stacked together, we will split into the individual images
x_valid.shape
(10000, 784)
**10,000 x 784 ** --> **10,000 x 28 x 28 **
(-1,28,28) - All neural networks, the first axis is a row, image, a sentence, example, then we reshape the last two axis
x_imgs = np.reshape(x_valid, (-1,28,28)); x_imgs.shape
(10000, 28, 28)
Example of a Reshape operation

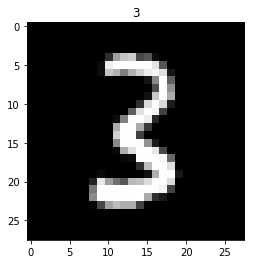
Look at a image sample - first img
show(x_imgs[0], y_valid[0])
Look at a labels - first label
y_valid.shape
(10000,)
y_valid[0]
3
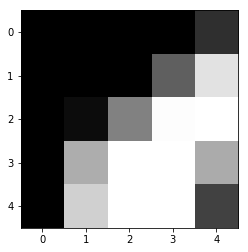
Look at part of an image (look at a portion of image #1)
Note we are using numpy’s indexing to get to a portion of a matrix
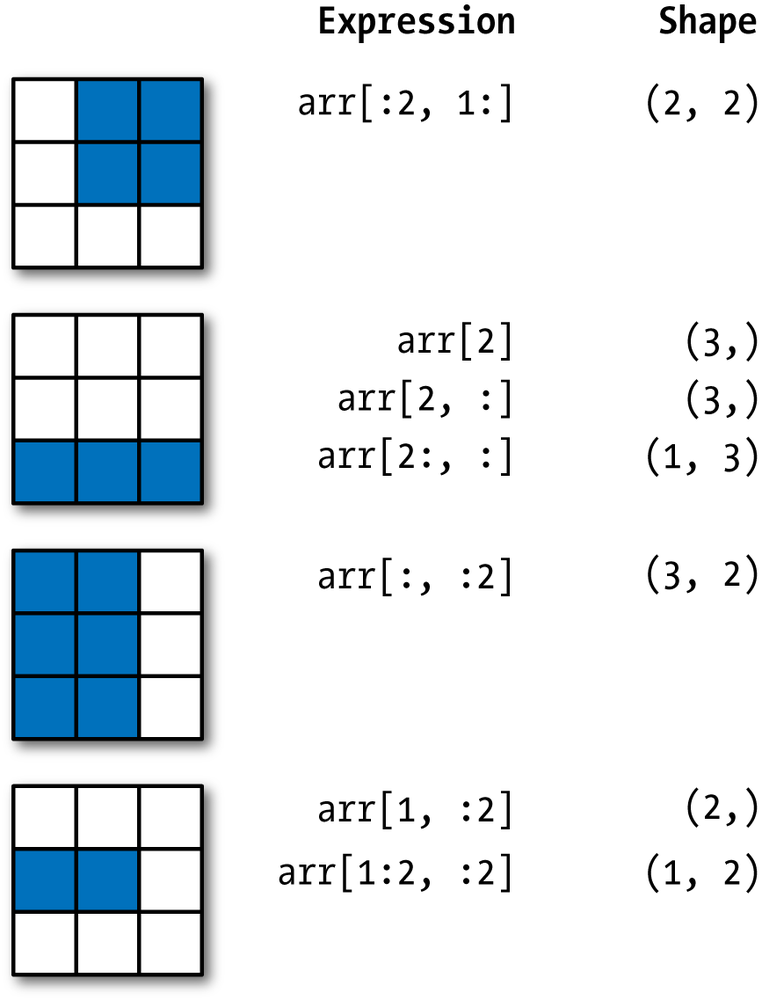
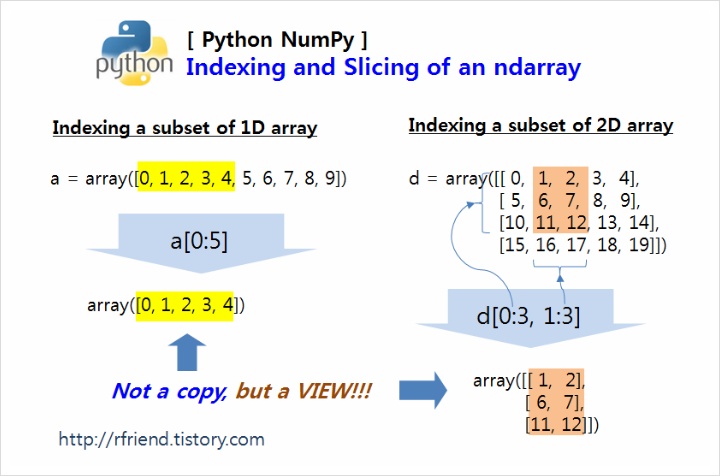
x_imgs[0,10:15,10:15]
array([[-0.42452, -0.42452, -0.42452, -0.42452,  0.17294],
       [-0.42452, -0.42452, -0.42452,  0.78312,  2.43567],
       [-0.42452, -0.27197,  1.20261,  2.77889,  2.80432],
       [-0.42452,  1.76194,  2.80432,  2.80432,  1.73651],
       [-0.42452,  2.20685,  2.80432,  2.80432,  0.40176]], dtype=float32)
show(x_imgs[0,10:15,10:15])
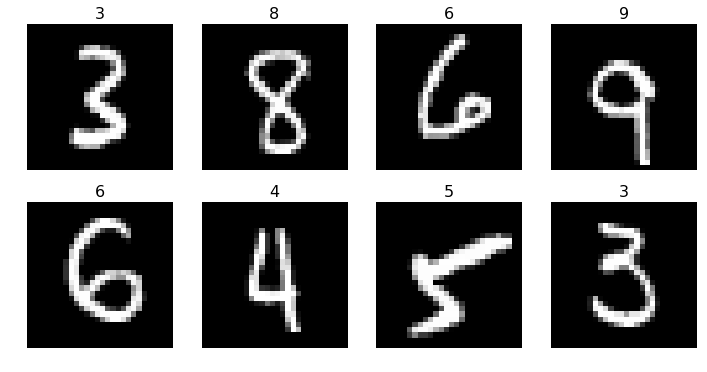
Preview some of the different classes of images
plots(x_imgs[:8], titles=y_valid[:8])
Intro to Neural Network
Class of mathematical functions. Supports the universal approximation function. It can approximate anything, assuming we make it big enough.
On Functions:
A function takes inputs and returns outputs. For instance, f(x) = 3x + 5 is an example of a function. If we input 2, the output is 3\times 2 + 5 = 11, or if we input -1, the output is 3\times -1 + 5 = 2
Functions have parameters. The above function f is ax + b, with parameters a and b set to a=3 and b=5.
Machine learning is often about learning the best values for those parameters. For instance, suppose we have the data points on the chart below. What values should we choose for a and b?
Animation (right image, fitting a function to the data):
So what is a Neural-Net?

Neural Networks with Pytorch
Graphical processing units (GPUs) allow for matrix computations to be done with much greater speed, as long as you have a library such as PyTorch that takes advantage of them. Advances in GPU technology in the last 10-20 years have been a key part of why neural networks are proving so much more powerful now than they did a few decades ago.
You may own a computer that has a GPU which can be used. For the many people that either don’t have a GPU (or have a GPU which can’t be easily accessed by Python), there are a few differnt options:
-
Don’t use a GPU: For the sake of this tutorial, you don’t have to use a GPU, although some computations will be slower. The only change needed to the code is to remove
.cuda()wherever it appears.
import libraries
from fastai.metrics import *
from fastai.model import *
from fastai.dataset import *
from fastai.core import *

import torch.nn as nn
Torch.nn Docs can be found here:
http://pytorch.org/docs/master/nn.html
Sequential PyTorchs
net = nn.Sequential(
    nn.Linear(28*28, 10),
    nn.LogSoftmax()
)#.cuda() #<--- signals to run on the GPU
nn.Linear(28*28, 10) - there are 28 x 28 images and output 10 size (for number classes). Linear layer, y = ax + b in a matrix format
nn.LogSoftmax() - This is the non-linear layer. These can be converted to comparative probabilities.
md = ImageClassifierData.from_arrays(path, (x,y), (x_valid, y_valid))
ImageClassifierData - wrapper for all the data
path - file path location
(x,y) - training data
(x_valid, y_valid) - validation data
x.shape
(50000, 784)
loss=nn.NLLLoss()
metrics=[accuracy]
opt=optim.Adam(net.parameters())
loss function - this is our primary metric to determine how we are doing better. How do we score? (lower is better)
nn.NLLLoss() class torch.nn.NLLLoss(weight=None, size_average=True, ignore_index=-100, reduce=True)[source]
The negative log likelihood loss.
fit(net, md, epochs=1, crit=loss, opt=opt, metrics=metrics)
Failed to display Jupyter Widget of type HBox.
If you're reading this message in the Jupyter Notebook or JupyterLab Notebook, it may mean that the widgets JavaScript is still loading. If this message persists, it likely means that the widgets JavaScript library is either not installed or not enabled. See the Jupyter Widgets Documentation for setup instructions.
If you're reading this message in another frontend (for example, a static rendering on GitHub or NBViewer), it may mean that your frontend doesn't currently support widgets.
[ 0. 0.31865 0.2866 0.91849]
Sample of a Binary Loss functin
def binary_loss(y,p):
    return np.mean(-(y * np.log(p)+(1-y)*np.log(1-p)))
acts_sample = np.array([1, 0, 0, 1])
preds_sample = np.array([0.9, .1, .2, .8])
binary_loss(acts_sample, preds_sample)
0.164252033486018
We could replace this with a if statement - see if you can scale it out to be a categorical cross entropy
Prediction 10000 x 10
For each of the images in the validation set, we are making 10 predictions (probability for each of the numbers)
preds = predict(net, md.val_dl)
preds.shape
(10000, 10)
Looking at single row
argmax returns the index of hte maximum value
preds[1]
array([-10.98194,  -7.74565,  -5.0269 ,  -4.07413,  -4.27588,  -3.71443,  -9.82602,  -9.61403,  -0.06536,
        -7.05641], dtype=float32)
preds.argmax(1)[:5]
array([3, 8, 6, 9, 6])
preds = preds.argmax(1)
np.sum(preds == y_valid)/len(preds)
0.91810000000000003
plots(x_imgs[:8], titles=preds[:8])

We see that the 4 is incorrect and the 3 is off. One of the reasons for this is not as accurate, is that we only have a single layer, and essentially making a logistic regression. A deep neural network will have many more layers.
net = nn.Sequential(
    nn.Linear(28*28, 10), <--- input is multiplied
    nn.LogSoftmax()       <--- then logistic regression is applied
)#.cuda()
Let’s Define Logistic Regression
Will do this by defining a pytorch class
torch.randn(3,4) # <-- similar to numpy language
 1.9552 -0.5213  0.3728  0.8425
-0.8652 -0.7114  0.4367 -0.0971
-1.0709 -0.0252  0.8083 -0.1447
[torch.FloatTensor of size 3x4]
torch.randn(3,4).cuda() # <-- similar to numpy language, but with GPU!
-0.3837 -0.9107  0.7963 -2.0376
 0.8746  1.1661  0.9240  0.1158
-1.3293  1.9849 -0.8541  0.0062
[torch.FloatTensor of size 3x4]
def get_weights(*dims): return nn.Parameter(torch.randn(*dims)/dims[0])
Initializing the random weights, that are nicely behaved. Mean =0, standard deviation = 1.
Basic Logistic Regression pytorch class (not a layer / nn architecture)
class LogReg(nn.Module):
    def __init__(self):
        super().__init__()
        self.l1_w = get_weights(28*28, 10)  # Layer 1 weights
        self.l1_b = get_weights(10)         # Layer 1 bias

    def forward(self, x):
        x = x.view(x.size(0), -1)
        x = torch.matmul(x, self.l1_w) + self.l1_b  # Linear Layer
        x = torch.log(torch.exp(x)/(1 + torch.exp(x).sum(dim=0)))        # Non-linear (LogSoftmax) Layer
        return x
(nn.module) <-- we are extending a pytorch class. we are borrowing all the methods from the standard module and will add some additional methods to it.
super().__init__() <-- as a result, we have to create or instantiate the standard module first
self.l1_w = get_weights(28*28, 10) is essentially the ax part of y=ax + b
self.l1_b = get_weights(10) is essentially the b part of y=ax + b
Pytorch special method: forward
forward - special hook in the pytorch library, how we are implementing each layer
You can register a function on a Module or a Variable. The hook can be a forward hook or a backward hook. The forward hook will be executed when a forward call is executed. The backward hook will be executed in the backward phase. Let’s look at an example.
x = x.view(x.size(0), -1) - is the reshape (flatten)
x = torch.matmul(x, self.l1_w) + self.l1_b - matrix multiplication
x = torch.log(torch.exp(x)/(1 + torch.exp(x).sum(dim=0))) - softmax from scratch
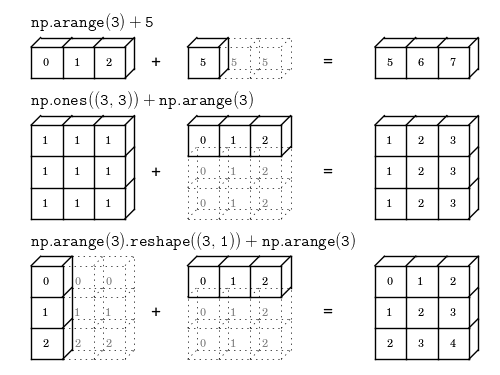
How the matrix multiplication works out (screenshot):
net2 = LogReg()#.cuda()
opt=optim.Adam(net2.parameters())
fit(net2, md, epochs=1, crit=loss, opt=opt, metrics=metrics)
Failed to display Jupyter Widget of type HBox.
If you're reading this message in the Jupyter Notebook or JupyterLab Notebook, it may mean that the widgets JavaScript is still loading. If this message persists, it likely means that the widgets JavaScript library is either not installed or not enabled. See the Jupyter Widgets Documentation for setup instructions.
If you're reading this message in another frontend (for example, a static rendering on GitHub or NBViewer), it may mean that your frontend doesn't currently support widgets.
[ 0. 2.43236 2.39509 0.90993]
np.sum(preds == y_valid)/len(preds)
0.91810000000000003
preds = predict(net2, md.val_dl).argmax(1)
plots(x_imgs[:8], titles=preds[:8])
To dos:
Play with pytorch tutorials,
- matrix multiplication
- play with tensors
- play with pytorch and functions