Woah @jmueller, this is such a cool idea and I love how you are using the app in your daily life!
Chart classifier - 1st simplest version
Following instructions in Chatper 2, I built a very simple classifier that predicts two classes: bar or scatter chart.

Live app:
(Seems I can only add one link, you can remove the spaces from the following links to access them, sorry)
https:// adver.tools/chart-classifier/
Code:
https:// www.kaggle .com/code/eliasdabbas/chart-classifier
What is potentially interesting about the training dataset is that I didn’t collect any images, I generated them! Since statistical charts are typically generated using some software, I was able to generate many variations for each type (~300 charts).
It’s still clearly very simple and potentially more advanced features can be added:
- More chart types: area, histogram, map, etc.
- Hierarchical classification: horizontal bar chart, grouped bar chart, stacked bar chart, and so on.
- Very ambitious: read chart contents, reverse engineer them, and generate code to recreate them.
I tested with some charts from the Economist as you can see in the video. Feedback, suggestions, more than welcomed.
Really enjoying the course/book. Starting to work on Chapter 4.
(posting at the right place now)
Hey, I’m Léo. Completly new to ML. I came to say this course is amazing. I am really happy to keep studying and learning. Today I published my first useless web app with ML(useless things is my best way to start with). I create a web app to upload a photo(or take it with the phone) and it will identify between a red iPhone, a red hammer or a Redbull. I work as a web designer using wordpress and something of html, css and js, and I’m loving enter in this new subject. You can check the web app at Red What?. It is in portuguese but the text is not really important.
1 Like
Hi everyone!
I wanted to share my latest blog post with you, where I discuss my solution for the Kaggle competition of disaster tweets using a transformer with the DeBERTa model. My approach achieved a high score of 83.308 and is based on the Fastai Lesson 4 and J. Howard’s “Getting Started with NLP for Absolute Beginners” Kaggle notebook.
I encourage you to check out the blog link. Additionally, you can find our Kaggle notebook notebook where we provide a step-by-step guide on how to implement the solution. I also invite you to upvote our Kaggle notebook if you find it helpful. Thank you, and I hope you find the blog post informative!
2 Likes
@peterkibuchi Hah, love the classifier idea! Anyway, I know the answer to your question because I ran into this too. Right now your code computes probability it’s Messi by calling probs[0]. Basically, probs is an array of prediction values that sum to 1. So what classes do probs[0] and probs[1] correspond to? You can find out by running “learn.dls.vocab.”
If you scroll to the bottom of my own notebook for lesson 1, you can see how I handled the logic of extracting the right probability. Don’t know if it’s the “best” solution, but it works ![]()
1 Like
After following along with Lessons 1, 2, and the first 30 minutes of lesson 3 I felt like I had enough knowledge to write and deploy a model pertaining to a little hobby of mine.
Geoguessr is this game where you get dropped down into a Google Street View location somewhere in the world, and the closer to your position you guess on a map, the less hp you lose.
My hope was that by training an image net on a large sample of Geoguessr-images, I’d be able to make it recognize different countries by their images.
I tried training it on a few different models for ~5 epochs with varying results.
Error rates:
resnet18 - 0.48
Resnet50 - 0.38
convnext_tiny_in22k - 0.39
levit_128 - 0.66
Being quite lazy and not yet having set up my local machine I added share=True to the gradio launch parameters and lo and behold - a working GUI with an image for an input and the 5 highest probabilities as an output.
Sadly the results were not quite what I had imagined. Over and over I fullscreened myself into the game, pressed Print Screen, exited out, pasted my image into Paint, and saved it so that I could hurl it at my Gradio interface. Not only did it not get a single one right - it’d usually be off the mark completely; tropical environments with broken roads giving a 97% verdict for Switzerland and North American Jeep-filled suburbs it ascribed to Poland were par for the course.
Jokes and dramatization aside, how would one troubleshoot/try to figure out what the reason for this is? Is it more likely to be a matter of the dataset being skewed, containing nothing that looks like what I inserted? I believe the dataset may have originally been in 21:9 format, while the ones I took were 16:10. Could this be an issue? I tried defining my input in gradio like Jeremy did by using shape=(224,224), to make it mimic my training data. I also tried disabling this, and neither yielded a single right answer.
Massive thanks to Jeremy and all of the other amazing people making this course a possibility. I could have never imagined any of these topics were as accessible as they are, and I’m having a ton of fun along the way!
1 Like
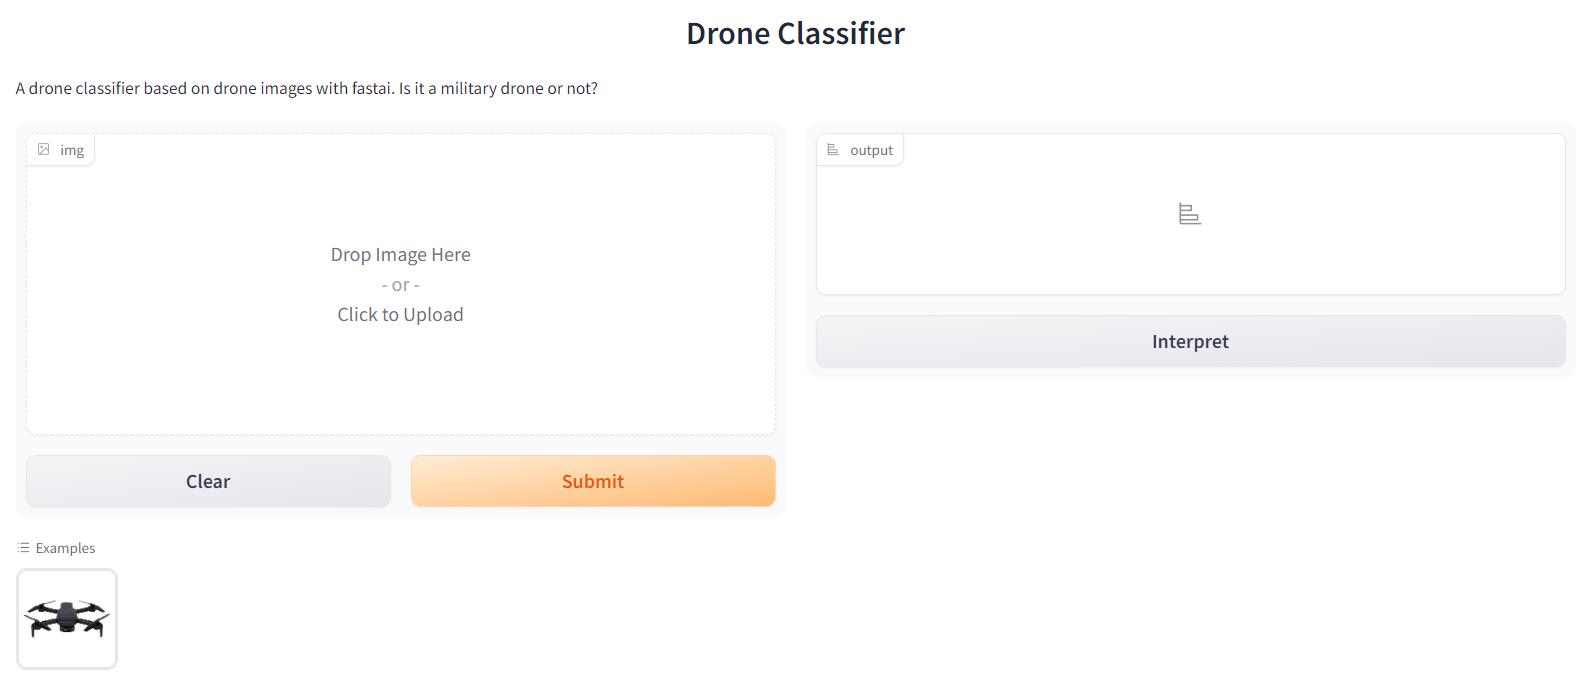
Hi everyone! Apologies for my late post ![]() it feels like drones have become a lot more usual in Europe since February 2022, thus I build a drone classifier so that I know what I am facing when I am out with my son: FlyingNordic - a Hugging Face Space by AlexA1222
it feels like drones have become a lot more usual in Europe since February 2022, thus I build a drone classifier so that I know what I am facing when I am out with my son: FlyingNordic - a Hugging Face Space by AlexA1222
Happy to get in touch > send me a mail to my profile here on fastai ![]()
2 Likes
Started the course this week!
Probably went a bit overboard - built a web scraper to get all the images I needed, actually spent very little time doing training…
But yeah, fun little task for Lesson 1 - took a load of heavy metal album covers and classified them by subgenre.
I’ve followed the original notebook (as far as training goes) pretty closely, but if anyones got any pointers of how I could sharpen it up / follow industry best practices, v much appreciated!
3 Likes
I made a hotdog - eclair classifier https://hotdog.jimryan.ie/
![]()
Currently dockerised and running on an aws ec2 instance
![]()
![]()
![]()
![]()
![]()
![]()
![]()
![]()
![]()
![]()
![]()
![]()
![]()
2 lessons in:
Smoking / Not Smoking image classifier.
It’s trained on screenshots / stills from movies as that’s what I hope to use it on - to discover which actor smokes the most in Hollywood, on screen at least.
I think I need a famous person classifier next ![]()
Hello everyone!
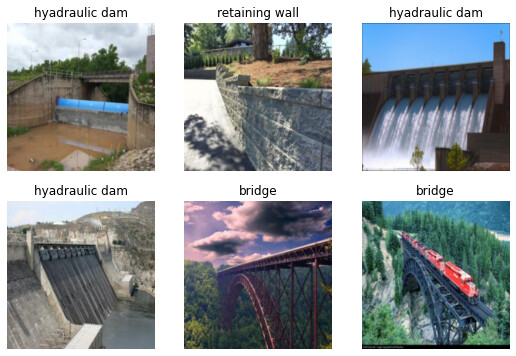
I just started this course two days ago. Being a Civil Engineering student, I played with the “Is it a bird?” Notebook of Lesson 1 and came up with my own model “Is it a bridge, dam or retaining wall?”
I’m excited for the upcoming lessons!
2 Likes
A few days ago I read a paper called “Common Diffusion Noise Schedules and Sample Steps are Flawed” ([2305.08891] Common Diffusion Noise Schedules and Sample Steps are Flawed) which proposes changes to how schedulers should schedule the noise in the diffusion process. Through some simple changes, it should enable diffusion models to produce images that are a lot brighter / darker than currently possible:
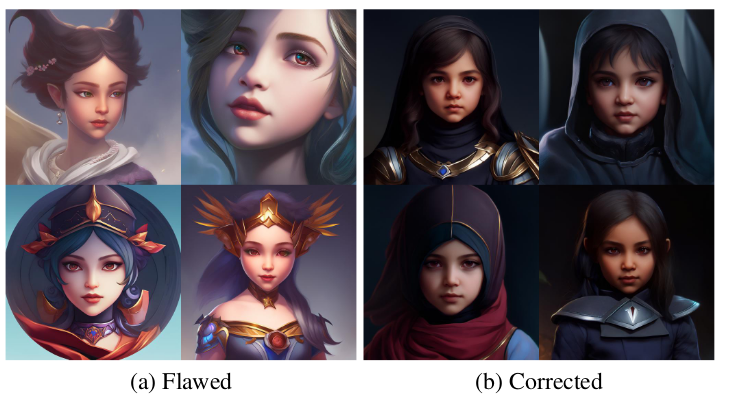
I’m currently studying part 2 of the course (at lesson 11) and though: Why not try to implement these changes in some real code and try it out? So, that’s what I did and even though I couldn’t reproduce the images (it would require fine-tuning a model with quite some compute I believe), I understood and applied all the math and concepts from the paper and implemented them on my own:
I learned so much about the math and related concepts, it was very much worth the experiment.
If someone finds improvements / ways to actually make inference work (by fine-tuning a model?) that would be a wonderful next step.
I hope that this notebook helps others understand the paper better.
3 Likes
So I started the course a few days ago, have to say it is really great up until now!
I created two things: First, an image classifier for a few animals. Was interesting to see how adding more animals actually made it much more accurate.
For anyone having trouble with the first notebook, it has to do with duckduckgo image downloads not working. Have a look at my notebook, I have changed it to use bing image search there, which seems to work.
The second thing I created is a very basic implementation of the titanic dataset on kaggle. I have worked on this competition 2 years ago when I first looked a little into ML/AI. I tweaked the dataset a little and played around with the tabular data classes, this is what I came up with:
https://www.kaggle.com/code/wozboz/titanic-fastai
It achieved 76,5% on its best iteration, which I feel is quite OK. Does not get you high in the rankings, but I have the feeling a lot of people on there are cheating ![]()
Anyone having any suggestions on what I did, I would be happy to hear them. Especially on what could be done better with the titanic example.
1 Like
Hello Everyone!
After completing my machine learning specialization , I started watching the fastai course and as part of lesson 1, i have implemented a tech gadget classifier using “Is it a bird?” notebook
Hello everyone!
After watching the first lesson, I created a simple image classifier to categorize pictures of Mark Zuckerberg and lizards. I initially had two queries, “mark zuckerberg” and “lizard,” but the model created from this limited data had a 50% error rate. To improve the model, I added three more queries. I guessed the model would improve with images of different lighting and different expressions (on Mark’s face), so I added the following queries: “mark zuckerberg bright”, “mark zuckerberg dark”, “mark zuckerberg happy”, “lizard bright”, “lizard dark”, and “lizard happy.” The model worked much better after this, going from a 50% error rate to a 1% error rate – which was very surprising! I guess the extra images and queries allowed the neural net to better “understand” the features of each item?
I later added a third category, “cyborg,” with similar queries. After training the model, the AI had a 4% error rate – pretty good! I had expected the error rate to increase because of the increased number of categories.
https://www.kaggle.com/code/klai30/zuck-vs-lizard-vs-cyborg/notebook
Would appreciate any advice, tips, and comments!
Excited for the next lesson, and to anyone reading this, have a great day!
I’ve just done “is it a bird?” assignment and received an error.
this is the link : https://www.kaggle.com/code/saforaaghadavood/is-it-a-bird-first-assignment
thanks in advance
Hello to everyone reading my message,
I was looking for a good course with practical implementations for deep learning, so I came to this course.
And I will be very honest Jeremy’s advice of learning how are these models practically used in the real world problems is a much better option than to first study the traditional mathematics and doing all the bone grinding work first, the later option just takes away that excitement to explore the domain.
So I am sharing what I built after taking the lesson 1 of the course:
Its a binary classification project that uses Jeremy’s approach, but in this code I classify between two different cars (for example: I classified between “Nissan GTR” and “Toyota Supra”).
Honestly I learnt about many things even if it was the very first lesson.
Looking forward to building some really nice projects.
Thank you Jeremy Howard and the FastAI team, for providing us with such a deep and elaborate course which focuses more on real world applicationMy Car Classifier
1 Like
Image_Classifier with github actions workflow
I just made my first model using the Jeremy’s video model.
Its purpose is to classify in two sides: NBA players or tennis players.
It’s basically the same model of the notebook.
https://colab.research.google.com/drive/1J8FY7BpVOKSUQB9TyfMiyYxUjWs-IogD#scrollTo=hXLEG8Eypzd7
Hi all,
I recently started FastAI DL course, and slowly moving through it. Last week I finished Lesson 1 last week but then realized that people were uploading their homework. So I started to search for a dataset in Kaggle.
Here I saw, Brain MRI dataset to predict the presence of brain tumours. This was the first time I used FastAI, so I read the basic parts of the document a lot.
Anyways, here’s my work;
1 Like