After watching the first lecture,I tried creating a classifier for classifying six categories of cricket shots, namely Cut Shot,Cover Drive, Straight Drive, Pull Shot, Scoop Shot and Leg Glance Shot.
For a brief context cricket is a popular sports in my country and there are different kind of shots that a batsman plays to score runs & a shot is characterized mostly by batsman’s playing posture and area of the field to which the ball is being hit.
I took the idea from this paper where the researchers achieved an accuracy of ~80 %.
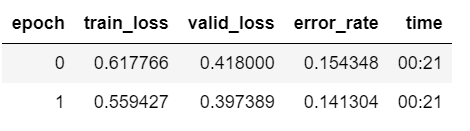
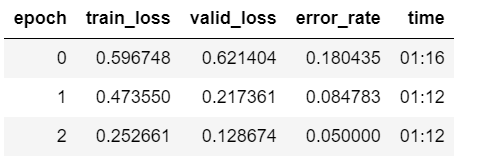
using the resnet34 gave an accuracy of ~86 % whilw with resnet50 it was ~95 % (please refer to the images below).
Exited with the beginning, looking forward to learn more.
Thanks @jeremy for the great tutorials and the inspiration ([this podcast])(https://www.youtube.com/watch?v=J6XcP4JOHmk) . I have been working in the field of data science for 3 years now and this feels like a beginning of a new phase for me.
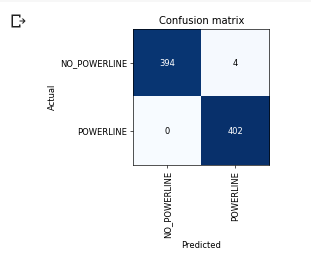
Hey everyone. I am in the energy/utility industry and wanted to try out something related to power lines.
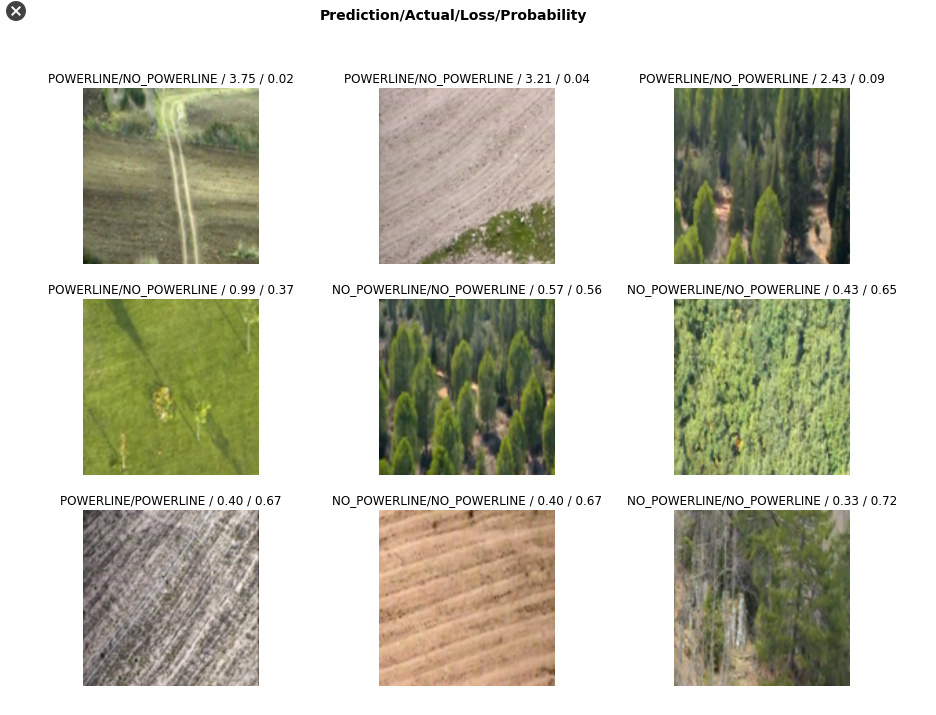
I made an image classifier that classifies an image as containing a power line or not. These are images taken from planes over different terrain.
I got an error rate of 0.05% with only 4 errors out of 800 images. This makes me very excited.
To join in the sharing festivities, here’s something I’ve recently done, which I’ve also written about more in depth here (friendly link so you aren’t hit by the paywall, because it’d be a a shame for the people that gave me the ability to do this to not be able to view it for free)
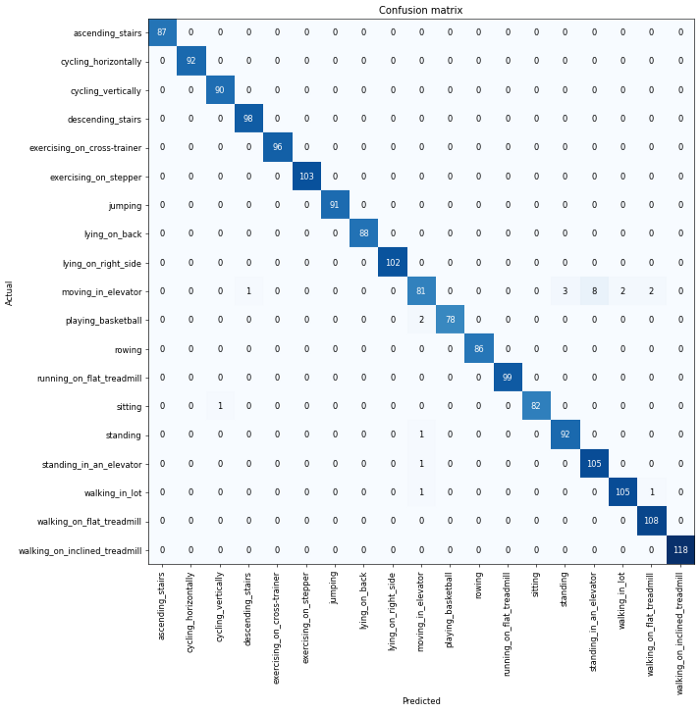
I took a look at a dataset + paper for human sensor readings, and attempted to do better by using a cnn. I created images like this:
for trying to classify the sensor data. A bit bizarre, but I thought what the heck, I’ll try it.
Turned out a resnet34 model applied to this kind of data did marvelously! I achieved an accuracy of 98.7% accuracy, above what the paper had achieved at the time.
Confusion matrix shows how little confusion there was:
Nice to see image classification put to other uses (transfer learning).
I think your model would be better than my Garmin watch as my watch cannot tell the difference between breast stroke and and front crawl.
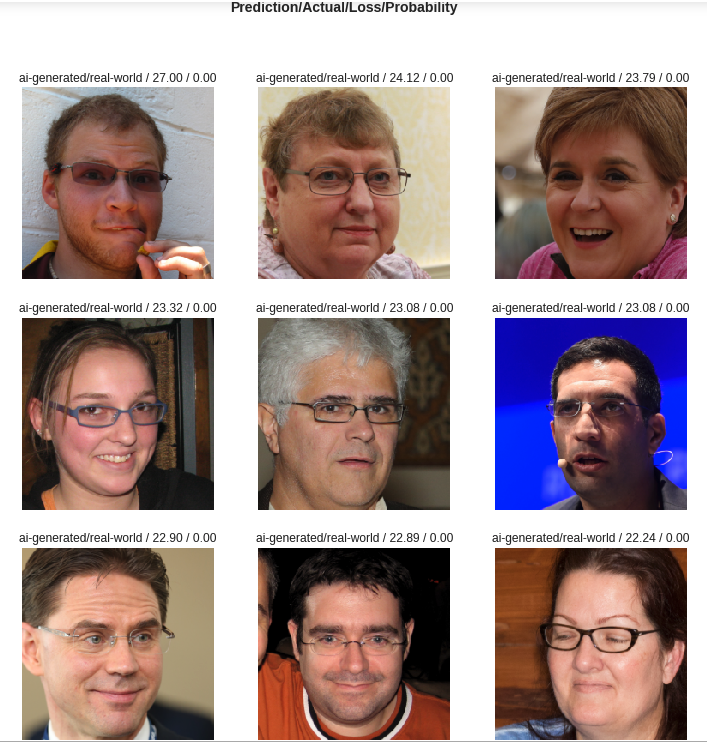
I’ve used the Lesson 2 material to create a classifier that looked at Nvidias AI-generator of faces. Then I expanded the scope and looked at how well my ML-classifier was predicting the original face images that were used to train the GAN Network. It revealed that the original images were biased and represented more heavily: white, middle-aged, round faces with glasses!
Any comment, feedback, or discussion of the result described further in the blog post is much appreciated.
Those look good As far as I know if you were overfitting the error would get worse (as only validation error is shown and that is not the case) I also had very good results with fruits-360, it may be because there is very little noise in the dataset. It would be interesting to compare those numbers to some dataset with fruits in more real enviroment. You should get used to fastai out of the box getting pretty impressive results
Here’s a writeup of a project I worked on with satellite imagery after completing Part 1 of the course. I used the Inria dataset to build a semantic segmentation model that can identify buildings in satellite images. The post has some details on a few tricks for working with large format images as well as some things I did to customize the network architecture. Hope somebody finds it interesting or useful!
really an impressive project and a beautiful two-part blog post, it was a joy to read.
The drop from 99.99% to 29% for the different test sets is remarkable. As is the fact that the misclassified images are, as you mention, heavily biased towards glasses-wearing, middle-aged white people.
Did you try using a part of the Flickr images as test set after training the model with another part of the Flickr set?
What can we infer from this? My initial gut feeling for such a classifier was that it was looking for small quirks, mismatches, color errors etc. to find the fake images. Low level features, if you will. But if it worked this way, the performance on the Flickr test set shouldn’t have decreased (as much), right? So the net seems to use other features, that are probably more high-level. And apparently not working as well when presented with the original training images for the generator.
Identify an aircraft by uploading a photo of 1 of 9 compatible aircraft types!
I don’t exactly understand the significance of it but I switched to a larger data bunch size with size=292 (looks at images in higher quality?) and I used resnet50 thinking this is perhaps a more complex problem to solve.
Thanks for sharing your thoughts and that you enjoyed my walkthrough of the project. Made me glad to hear
That was a great idea you had there, to both train and test with different parts of the Flickr dataset. Didn’t cross my mind, that’s why you should be more than yourself in an ML-project, to bounce ideas within a team. The result for the 29% accuracy should be bounced up undoubtly!
I too think the DL model has picked up on more high-level stuff to make its prediction. Because if it used low level features, it should have picked up on some of the fake cat images I fed into the end result, some of witch were very blurry or had very obvious AI-artefacts, but it didn’t at all.
One thing I haven’t got a grip of, is on the Top Losses collage (the top blog post featured image) with all the glasses and middle-aged white people, it prints out the probability for it’s classification to be 0.00xx. Which I assume means it’s very very very confused about if it’s from the real-world or if it’s AI-generated. So it’s almost like a Russian Roulette with 50-50 chans. But the classification then was finally made on the Loss being the highest I assume.
Do you @johannesstutz have more thoughts about that and what can be inferred then?
@JonathanSum I’m glad you liked it
I haven’t tested any drawn face images myself.
Have I understood it correctly, you made an AI that outputs the images on the right row, with the images on the left row as input. And the originals are the ones in the middle row?
The question is: how would you get the model to catch more artifacts, or lower level stuff? Maybe more diverse training sets from different sources? With all the fake news around (and “deep fake” images and videos), I think this is an interesting real-world problem!
Regarding the probabilites of Top Losses: As far as I know, the probabilities of all classes always add up to 1. So a low probability for one class means a high one for the other, since there are only two classes (AI generated / real world). My interpretation would be, that the model was VERY sure about the images in Top Losses, it just got it wrong
After finishing the first lesson in the Deep learning course, I decided to try it out at a Whatsapp forward I received. I was curious, intrigued and wanted to prove the post is wrong.(Posted the image here)
I worked on this project and have written a blog post. I have done the below steps.(All free at no cost to me)
Train the model
Export the model
Create a Flask API and deploy the model on Google Cloud Platform.
Btw, about your thread about fake news, somebody commented on the blog that s/he was testing with an image from social media and found out the classifier predicted it as AI-generated
The given probability is the predicted probability for the true class, so in this example real-world. The documentation is not that clear, unfortunately.
Since the predicted probabilities add up to one, close to 0% in one class means close to 100% in the other, if you have two classes like in your case. This means, that your model is - for the pictures in Top Losses - close to 100% sure that they’re AI generated. Not a 50/50 situation but a very confident, although wrong prediction
Nice work! I tested your model and it got a C172 right, but my beloved Beechcraft Bonanza wrong
To further reduce the error rate, the easiest thing is often to add more data. How many images per class did you use?
The size parameter defines the resolution of the images, so in your case 292x292 pixels. I recently tried an aircraft classifier as well, I found that a resolution of 512x512 worked very well, although it increases learning times a bit. Just try different values. For reasons that go above my head, Resnet34 worked much better for me than Resnet50 (~10% difference in accuracy!)
Ah, thanks so much for the clarification @johannesstutz! It just didn’t make sense for me before.
That is interesting, that a real-world picture is like 100% predicted as AI-generated. It must mean that when the generator wants to produce say glasses, it has a fix idea from the original Flickr images, that “mother of glasses” look exactly like the ones it has been presented with.
My employer wanted me to write a third piece to our blog to cover the summer drying of content. It’s the same project but I’m focusing not so much on the project problem and result but on how much data was used for experimentation and graphed out how many epochs I needed to run for my result.


 As far as I know if you were overfitting the error would get worse (as only validation error is shown and that is not the case) I also had very good results with fruits-360, it may be because there is very little noise in the dataset. It would be interesting to compare those numbers to some dataset with fruits in more real enviroment. You should get used to fastai out of the box getting pretty impressive results