Share your work here ✅

Is this being ran as a flask web app?

Created the image classification to classify stop, yield and school crossing; Here is the snapshot of my notebook. Need to clean up the date to get more accuracy - currently getting 14% error.

My Input data from google image

Train model/rate


Inference - pretty cool :slight_smile:

1 Like

No this is not a flask app. I am running this project using tool opencv. I found that if we use opencv along with fastai library then we get segmentation fault error. I am not sure why this error occurred. If anyone has encountered this issue and has some resolution, then it will really help me to further built a web app for this current application.

@jeremy @swagman tried the same thing and got similar accuracy ~95%. I think I just lost patience and a few more epochs would take me to ~96-97%.

What model did you use?

(Still working on improving accuracy and sharing this later on)

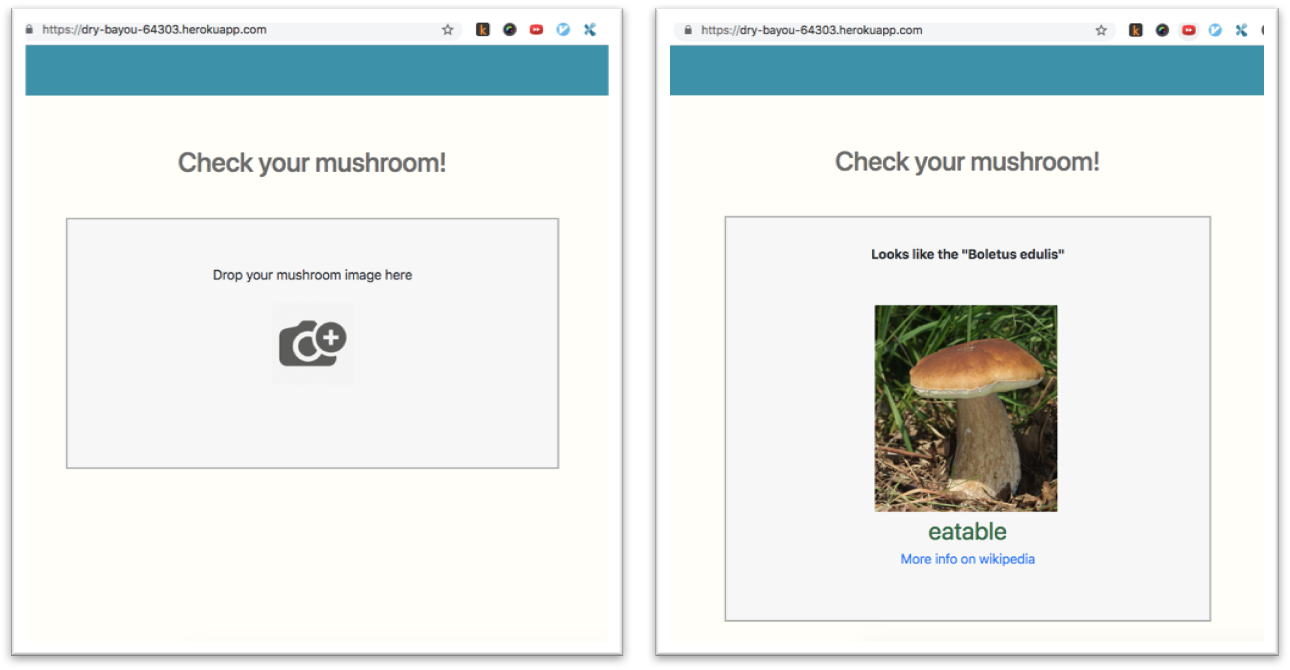
Made a mushroom classifier (including +/- 100 type) so you can pick some (eatable) mushrooms in the forest :slight_smile:

I created the web app in Flask and deployed on Heroku - https://dry-bayou-64303.herokuapp.com/

(https://github.com/ramonhollands/mushrooms)

10 Likes

After a couple data sets that worked well, I tried a really fine grain data set of various similar stringed instruments. The tenor, concert, soprano are all ukuleles for example:
([‘banjo’,
‘banjolele’,
‘bariguitar’,
‘baritone’,
‘bass’,
‘concert’,
‘doublebass’,
‘guitalele’,
‘guitaracoustic’,
‘guitarelectric’,
‘mandolin’,
‘soliduke’,
‘soprano’,
‘tenor’,
‘ubass’,
‘violin’],
16,
1189,
325)

image

Total time: 01:49

epoch train_loss valid_loss error_rate
1 1.253016 1.463084 0.446154 (00:26)
2 1.170810 1.462633 0.486154 (00:28)
3 1.026609 1.247020 0.415385 (00:26)
4 0.859524 1.187210 0.393846 (00:27)

40% looks bad, but with this data set it did pretty good. the larger numbers in the confusion maxtrix are very similar instruments. also, most of the top losses are effectively miss classified.

have a couple disney princess mugs around the house that have the same colors and design motifs of that princess. repunzel:

i trained a model with images of 5 disney princesses themselves, and then tried to feed in the mug to see if the color or design elements were enough to bucket it as the correct princess. The model to pick between the 5 princesses in the data set was fairly good, about 5 %. it failed however to identify the mugs. The mug above was classified as Tiana, and the Snow White mug was flagged as Repunzel.

i think i did too many epochs here. it looks like it overtrains a little and finds its way again
Total time: 01:37
epoch train_loss valid_loss error_rate
1 0.151588 0.277224 0.106796 (00:09)
2 0.135634 0.228471 0.077670 (00:11)
3 0.104969 0.201389 0.058252 (00:10)
4 0.096066 0.189406 0.048544 (00:09)
5 0.082029 0.162866 0.067961 (00:09)
6 0.071522 0.182156 0.058252 (00:09)
7 0.062653 0.201009 0.058252 (00:09)
8 0.058462 0.186100 0.067961 (00:08)
9 0.052997 0.165251 0.058252 (00:10)
10 0.048404 0.157111 0.048544 (00:08)

image

resnet50 did a little better but basically the same top losses. here i thought i might of had the learning rate too hight, but it finally settled down:
learn.fit_one_cycle(10, max_lr=slice(8e-5,8e-4))

image
Total time: 01:53
epoch train_loss valid_loss error_rate
1 0.164247 0.230282 0.067961 (00:11)
2 0.112986 0.227918 0.077670 (00:11)
3 0.096869 0.294595 0.087379 (00:11)
4 0.085803 0.348838 0.126214 (00:11)
5 0.070907 0.180965 0.097087 (00:11)
6 0.081053 0.120536 0.048544 (00:11)
7 0.069127 0.182275 0.048544 (00:11)
8 0.059278 0.175658 0.048544 (00:10)
9 0.051978 0.154336 0.048544 (00:11)
10 0.048301 0.144162 0.038835 (00:11)
image

1 Like

Session conversion prediction based on clickstream data

Problem statement: Predict probability of conversion in user’s last session(site visit) given clickstream data of users.

Business use cases: Large online businesses(e-commerce, digital media, edtech) selling a product has a notion of conversion(purchase). The product and marketing team wants to know the likelihoods of a user making a purchase based on user’s recent activities and past behaviors. This helps them target users in a promotional/retargeting emails/ad campaigns, and also discover key signals contributing to conversions.

Model definition: p(conversion on last session | events up to last X days, user)

Traditional approach:

  • Create RFM(Recency, Frequency, Monetary value) features from clickstream event time series. Excellent read on this topic: https://www.kdd.org/kdd2016/papers/files/adf0160-liuA.pdf
  • Create a structured dataset with a target label(user converted or not converted on the last visit) and predictors(features)
  • Use GBM or Logistic regression or SVM

Challenges with the traditional approach:

  • Clickstream event data is messy, each event contains several dimensions(time, metadata, taxonomy)
  • It is extremely hard and time-consuming to manually create features from this large feature space
  • Feature engineering requires domain understanding
  • Capturing hidden patterns in browsing patterns is hard
  • GBM works reasonably well in the presence of good features, not otherwise

Approach with CNN:

  • Represent clickstream as a heat map matrix
  • Heatmap contains x-axis: time intervals, y-axis: events, cell value as number of event occurrences in a given time interval
  • Normalize the heatmap intensity, i.e count values goes from 1 to 50. Mask all cells with no activity

Benefits

  • Can use simple aggregation such as sum as the intensity value
  • No special treatment for an event. Could easily normalize intensity for each event based on event count distribution across users.
  • (Hyperparameter) Use variable time intervals - smaller for recent history, larger for old history
  • Automated feature engineering - learns hidden browsing patterns
  • Transfer learning: use this approach to learning embeddings of user clickstream, use in other models as features or use it for user segmentation(clustering)
  • Less overfitting compared to GBM

Limitations:

  • Using different aggregates as cell values
  • Not practical to use this approach alone for prediction. Often user attributes need to be included in the model as well, which are numerical/categorical

Exercise

  • Training row: User’s activity up to last 7 days since their last session
  • Target label: purchase or no purchase in the last session
  • Time intervals - 5 mins up to 1 hour, 1 hour up to 1 day, 1 day up to X days
  • Dataset - tried this for an e-commerce client, however, this approach is vertical agnostic.
  • Dataset size: 15k images, 4% conversion rate. Next step is to test on bigger dataset
  • Events - [pageload, product_view, add_to_cart, wishlist, checkout, purchase, email_click, email_open]

heatmap_sample

Performance:

Update 2: Tried cropping and padding the image at center (0, 0.5) and using the 244x244 image size. This ensure that critical part of the image is not cropped. The accuracy is still the same. At this point, it looks like there is no issue with the learner and we could blame the dataset. Most top losses samples are new users(with no prior history) who converted with few activity. A better dataset and some baseline models to compare the performance would be the next step.

TODO: Benchmark against XGBoost/GBM.

crop_pad_tfms = [crop_pad(size=244, padding_mode='reflection', row_pct = 0.5, col_pct = 0.0)]
tfms = (crop_pad_tfms, crop_pad_tfms)

data = ImageDataBunch.from_name_re(path_img, fnames, pat, bs=bs, ds_tfms=tfms, size=244)

Update 1: Model isn’t performing too well on True labels. 96% accuracy is mainly attributed to TNs. I’m not sizing the image to size=224 as recommended for resnet setting because this takes the image edges out, edges contains the most meaningful information(recent activity). Could this be contributing to the performance? I don’t fully understand the implications of this recommended size setting but I could recreate images such that meaningful information is not lost on resizing to 224. This would verify the assertion. ds_tfms aren’t applied.

TODO: Extend the lookback window(currently 7 days) to borrow more past browsing behaviors

24 Likes

Hi all!

“Inspired by” this great song I decided to make a useless web app that can count the amount of fingers on a hand.

I never build something real with Python, so this was a cool challenge.
I decided to use Django as a framework and deploy it on an $5 / month Ubuntu server, just to see how that would work. Digital Ocean’s tutorials on the server setup were of great help.

The dataset is a combination of Google Images and a Kaggle Sign Language Digits Dataset.
With the Kaggle dataset alone I could get to 0% error rate in a Jupyter Notebook, but this dataset consists of a lot of similar pictures that all have a white background and good lighting.
To make it work with more diverse images proved to be much more difficult. The current accuracy is ± 80%.

Although I would have loved to make something with real value, this was a fun exercise and I learned a lot. Looking forward to next week!

15 Likes

I hope the accuracy is >99%! Could get dangerous!! :yum: :flushed:

2 Likes

I’ve built whatcar.xyz to guess the Make and Model of photos of cars.

It currently classifies around 400 models of the most popular cars in Australia

It has 88% accuracy on a balanced validation set (although there are some duplicates in my dataset; if any leaked into the validation set this is optimistic). This is pretty impressive since some of the models are really similar
kompressor

Building an app is a great experience; being able to test my model live with photos from my phone is amazing and helped me understand my model a lot more. My first iteration only had 50 models and I had to hunt for the cars it could classify; now it does most models I see on the street and is generally in the ballpark with classification.

The server code using Starlette is at https://github.com/EdwardJRoss/whatcar. I’ll do a write up and share a training notebook on the weekend.

I’d love to hear feedback if you try it out; unfortunately it won’t work on car models not sold much in Australia.

12 Likes

Pretty cool.
How did you get the data.
Did it manually?

88% might be really good, though. Oftentimes, or maybe most of the time, the external cues for the model variations amount to little more than trunk badges or chrome trim vs body-color trim. I bet the accuracy would improve materially if your classes were just a bit broader, like Mercedes C-class, 4th gen, etc. Of course, updating the labels would be a fair bit of manual work, but you could use the new image relabeler that just came out to replace / supplement the FileDeleter.

1 Like

I tried to create a model to identify different people. I thought it would be challenge if I train it on actors who look different in different movies with make up and transformations. So I trained it it identify three actors who rule the Bollywood Shahrukh Khan, Salman Khan and Aamir Khan. I was able to achieve 95% accuracy using resnet50.

. The gist of my notebook can be found here.
Few learnings:

  1. More data + Improved data quality helped improve accuracy. Thanks to @cwerner for fastclass.
  2. FastAI defaults are amazing. The same code works most of the times.
  3. Overfitting is when error rate starts to gets worse. It helped me train my model more.

Hopefully, I’d be able to improve it further with future learnings.
The model will always predict something, so I thought it would be fun to find out which Bollywood khan do you look like? You can check that out with this app here.
In this picture Jeremy looks like Aamir Khan if you were wondering:

3 Likes

I’ll admit I’ve spent most of the week googling and searching the forum to answers on errors I’ve gotten, dealing with jupyter notebooks not opening in my browser, trying to set up a new paperspace machine, etc. There have been some quite discouraging moments but also a lot of learning moments - and I think that’s valuable even if my models aren’t the coolest!

I decided to use the google image scraper method to do an piano accordion / bayan classifier. I originally wanted to include the concertina and the bandaneon but getting a clean dataset with these was fairly difficult.

What makes them different?
All of these are reed wind instruments that are pulled open and pushed closed to pass air through.

  • Piano Accordion - Keys on one side, buttons on the other. Large.
  • Bayan - buttons on both size. Same size as accordion usually. Type of button key accordion.
  • Concertina - small, square or hexagonal shaped. Buttons on both sides.
  • Bandoneon - small - square shaped.

As you can see the accordion and bayan can look very similar. The biggest trouble is that bayan is also the name for a drum instrument. Finding bayan accordions can lead to a lot of images of accordions or comparisons between the two.

Images of people playing the instruments can sometimes block one of the sides, and both sides need to be visible to tell between the styles.

I played with different models, learning rates and epochs quite a bit, and am fairly happy with the error rate I’ve achieved - I’ve been getting 50 & 40% when I started out. When over-fitting the model I got 36%


42%20AM

Although I feel I’ve had a slow start this week I still wanted to share what I’ve been able to achieve this week - I’m still proud!

(I also play the accordion.)

6 Likes

Please don’t at(@) jeremy.
It’s mentioned in many places.

If you want him to read your post, this is the worst thing you can do.

I’ll remove it. Thanks for pointing it out.

+1 wrt to the effort needed to set up the work environment and create the datasets. We can rest easy, though, knowing that we’ve started developing a full machine learning / data science skill set. That is, we can tell potential employers that we don’t need carefully curated datasets or $12k custom desktops to make valuable contributions.

At least, that’s what I keep telling myself.

2 Likes

Hear hear! That’s what I keep telling myself while I apply for jobs…