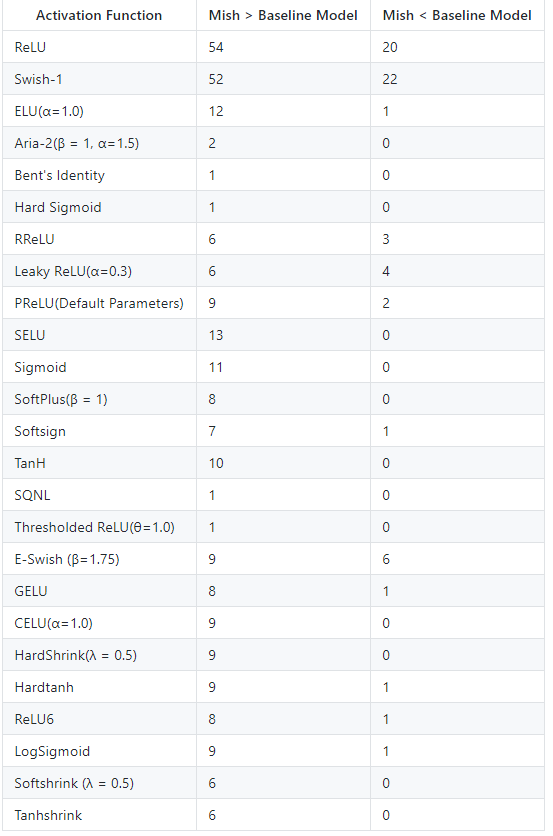
Also this is the updated benchmark table as of now. (All benchmarks are best of 2 runs)
4 Likes
Please don’t do that.
People are working hard to do the best they can, and the community is helping each other to get better and better. Let’s support them in that process, rather than slapping them down.
15 Likes
Really nice work @Diganta! I think you’re the only one I’ve seen out of all the activation papers I’ve read even attempting these kind of comparisons.
3 Likes
@LessW2020 I agree with your insight now that I’m getting a better picture of how your flat cosine training runs with the learning rate. Also whether you take the suggested lr and get it in range by dividing it by two or computing true difference*suggested LR, it’s fascinating to see how the idea of automating the lr finder applies in this case. There’s an adjust_value parameter in the suggester that just acts as a coefficient value for which you can apply any of your ideas to obtain an optimal compute.
Thanks for the really interesting and astute observation you made out of using the suggester! The plan was always to make development and research easier with the automated suggester, so I think I gained some more understanding in seeing its reaction with your training.
3 Likes
Looks great! Have you tried to swap momentums - to use 0.85 on the first phase and 0.95 on the second? I believe that can work better since we have smaller LR we can afford bigger momentum.
2 Likes
Hi @grankin - it’s a good idea. I’m running some tests right now so will try and update in about 10 minutes. 
1 Like
Thanks @grankin I’ve played around a little bit with it… I did not see too much of a difference, but then again I did not try too hard. I condensed the code as this is what sgugger wanted. Here it is:
class FlatCosAnnealScheduler(LearnerCallback):
  """
  Manage FCFit training as found in the ImageNette experiments
  https://forums.fast.ai/t/how-we-beat-the-5-epoch-imagewoof-leaderboard-score-some-new-techniques-to-consider/53453
  Based on idea by Mikhail Grankin
  """
  def __init__(self, learn:Learner, lr:float=4e-3, tot_epochs:int=1, moms:Floats=(0.95,0.999),
             start_pct:float=0.72, curve='cosine'):
      super().__init__(learn)
      n = len(learn.data.train_dl)
      self.tot_epochs = tot_epochs
      self.anneal_start = int(n * self.tot_epochs * start_pct)
      self.batch_finish = (n * self.tot_epochs - self.anneal_start)
      if curve=="cosine":
          curve_type=annealing_cos
      elif curve=="linear":
          curve_type=annealing_linear
      elif curve=="exponential":
          curve_type=annealing_exp
      else:
          raiseValueError(f"annealing type not supported {curve}")
      phase0 = TrainingPhase(self.anneal_start).schedule_hp('lr', lr).schedule_hp('mom', moms[0])
      phase1 = TrainingPhase(self.batch_finish).schedule_hp('lr', lr, anneal=curve_type).schedule_hp('mom', moms[1])
      phases = [phase0, phase1]
      sched = GeneralScheduler(learn, phases)
      self.learn.callbacks.append(sched)
(PR is still pending)
1 Like
One thing I’d like to mention here is I’m currently having very mixed reactions with applying our techniques on tabular data. For example: Let’s take our two datasets that fastai teaches, Adults and Rossmann. Both of which, after applying our techniques, I saw little to no improvement. I did see some quicker training time for Rossmann in terms of epochs, but I haven’t tested for statistical significance yet. Anecdotally it seems good but close. (By close I mean epochs to reach X score). For adults, I just saw no improvement whatsoever. Which was disheartening.
However, on the flip side of things. When I applied this to datasets that I am doing research on, I did see statistical significant differences! Adult’s I am aware does not really forgo improvement much, I’m fairly certain that the 89% maximum that is currently achieved is about it (for Adults). But I was quite disappointed by Rossmann. So I’m unsure where to go from here honestly. On one hand it didn’t work on both of our example baselines. On the other it worked extremely well (I went from 94% accuracy to 98% accuracy, paper to be published eventually). This problem was a multi-class problem where we had 7 classes. Thoughts? Ideas? Perhaps a way to try attention with tabular data? I did somewhat of an attempt (granted it was probably very poor) and it did not work well. Feel free to mark input
1 Like
well I ran everything twice but unfortunately dropping the momentum didn’t help…the one possible improvement was .925 vs .95 (but would need to be tested more…)
Otherwise everything else was too aggressive - I tested as low as .7, then .8, .85, .90 and .925.
.925 or .95 are still the best.
My guess is early on we also run the risk of overshooting and zipping into a bad minima with the higher momentum and thus don’t help ourselves as much as we hoped.
Anyway, thanks for the idea @grankin - that’s what we need to keep improving!
1 Like
Well I found out something while testing - what was really blowing up the model wasn’t the lr suggested…rather the weights for Ranger aren’t being put back as expected after running the lr finder.
This is likely a bug in Ranger, but what’s happening is Ranger keeps a second set of weights…they are left in the state from the super high rate tested at the end of the lr testing. Only the main /base weights are being restored after the lr find.
Thus when I do lr_find, and then do an actual run, I have grossly inflated weights for half of ranger and it blows up…
I found that out when I ran the finder, then went ahead and went to our normal optimal lr and it blew up just like with the suggestions ![]()
So sorry about that - this is something I’ll try and fix tomorrow and then we can test it with proper results.
(I still suspect my earlier intuition makes sense, but it’s clear now the lr finder is not nearly as off as all the accuracy blow ups I hit. That was from the second half of Ranger weights being in a bad state from the end of the lr finder, at super high rate, runs).
2 Likes
Guys, could you please slow down a little bit for me 
I am picking all the ideas up from this thread and the related ones to try them on different architectures and tasks. At this point, it is literally impossible for me to keep up. You are all doing an amazing job!
3 Likes
What are these output landscapes showing? x, y axis? How are they generated? I’m just having a little trouble understanding what I’m seeing. I tried looking at your paper and googling but I couldn’t get anything.
@Diganta you can correct me if I’m wrong here but to my knowledge loss landscapes are like a topography map of sorts, and the “smoother” a peak is the better. EG it’s a nice easy peak to reach for optimization as compared to something jagged.
For example this is from the “Visualizing the Loss Landscape of Neural Nets” paper 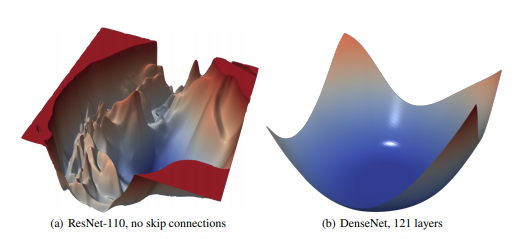
From this we can assume that DenseNet would fit easier with those skip connections, same concept. The smoother this landscape is, the faster we can get to the “right” answer.
Now let’s look at the color maps before us. If we consider where red and blue meet as our mountain-like peaks, we can see that ReLU’s is quite severe, turning in a few directions. Whereas Swish and Mish’s are nice and very smooth.
If I’m not 100% right in that explanation do let me know @Diganta ![]()
@sgebrial @muellerzr this is a snippet from the Swish Activation Function paper by Google Brain:
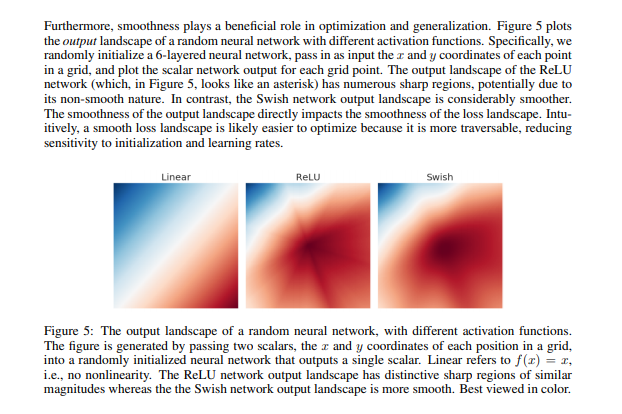
The outputs present in the Mish paper correspond to these outputs itself.
5 Likes
@Diganta thank you for this! That helps a bunch. I am slightly confused now though. If we follow (roughly) how those are colored, in your visuals I can see the “asterisk” like landscape from ReLU, but what is the major difference between the Swich and Mish activation? To me they look just reversed (color-wise). Does this mean that in terms of how (in comparison to the google paper) that Mish has an even smaller almost “bullseye” effect? (Eg dark red area)
** Scratch that. Forgot to read the next sentence “Mish and Swish are extremely similar in their corresponding output landscapes”
@muellerzr I think you’re confused with “Output Landscape” vs “Loss Landscape”. In case of loss landscape the variation in the colormap of the contour represents regions of Maxima and minima. However, in output landscape, this simply refers to the flow of gradients. So if the landscape is smooth, the flow of gradients is better. It also thus corresponds to better loss landscapes which are easier to optimize and thus network generalizes better. There is not much difference between Swish and Mish thus their output landscapes are extremely similar, the flipping colors don’t convey any message, it’s the transition that does.
3 Likes
Got it! Thank you Learn something new every day!
1 Like
Can you change the default for tot_epochs =1? Right now you blow up if you run with just the defaults:
---------------------------------------------------------------------------
TypeError Traceback (most recent call last)
in
----> 1 test2 = FlatCosAnnealScheduler(learn)
in init(self, learn, lr, moms, start_pct, start_epoch, tot_epochs, curve)
11 n = len(learn.data.train_dl)
12 self.start_epoch, self.tot_epochs = start_epoch, tot_epochs
—> 13 self.anneal_start = int(n * self.tot_epochs * start_pct)
14 self.batch_finish = (n * self.tot_epochs - self.anneal_start)
15 if curve==“cosine”:
TypeError: unsupported operand type(s) for *: ‘int’ and ‘NoneType’
Otherwise, if I set tot_epochs=1 then things look good!
1 Like
I adjusted it so Also got rid of start_epoch, as technically we calculate that ourselves 
1 Like
Here’s what’s going in the library now (hopefully, atleast in the most recent version of the PR). You can still use the fit_fc function with it, as a GeneralScheduler is a callback in itself:
def FlatCosAnnealScheduler(learn, lr:float=4e-3, tot_epochs:int=1, moms:Floats=(0.95,0.999),
                          start_pct:float=0.72, curve='cosine'):
  "Manage FCFit trainnig as found in the ImageNette experiments"
  n = len(learn.data.train_dl)
  anneal_start = int(n * tot_epochs * start_pct)
  batch_finish = ((n * tot_epochs) - anneal_start)
  if curve=="cosine":
      curve_type=annealing_cos
  elif curve=="linear":
      curve_type=annealing_linear
  elif curve=="exponential":
      curve_type=annealing_exp
  else:
      raiseValueError(f"annealing type not supported {curve}")

  phase0 = TrainingPhase(anneal_start).schedule_hp('lr', lr).schedule_hp('mom', moms[0])
  phase1 = TrainingPhase(batch_finish).schedule_hp('lr', lr, anneal=curve_type).schedule_hp('mom', moms[1])
  phases = [phase0, phase1]
  return GeneralScheduler(learn, phases)
*Only difference between how it originally was is the return function, go figure lol. Simplicity is the best quality after all
1 Like