Yes, I agree on that but there’s no actual way to prove it even. Just seeing scores exceeding a threshold doesn’t indicate to be increasing learning capacity.
Yes, he’s talking about practical significance. So few questions would be:
- What’s the practical significance for us? And how to confirm that?
- Should I obtain the 95% CI also for the results?
This is a very good blogpost - https://statisticsbyjim.com/hypothesis-testing/practical-statistical-significance/
I believe I should increase my sample size. Will 10 work? That’s I guess the max I can do based on the resources I have.
Agreed that 3 epochs is a bit low on the scale but I have seen consistent performance of Mish on other tests which required 5 runs so I doubt whether it is that I got lucky. I can certainly do 5 runs, no issues. But the thing that makes more sense is CIFAR 10 being a low variance dataset. But then how would you prove it otherwise, what dataset should I use? ImageNette and ImageWoof aren’t standardized dataset to convince a reviewer having result based on them and also I have no computational resources to go for multiple runs on ImageNet. So what exactly I should do?
Also it’s about comparison. It isn’t possible that even on 3 runs Mish got lucky and every other activation function somehow performed way bad than how they would have performed. So I don’t think it’s a case of being lucky (because it makes no mathematical sense) but I do agree that CIFAR 10 maybe is a low variance dataset.
Hi Diganta,
You may want to take a look at this blog post. The concept of effect size is also used in medicine to report the practical clinical significance of a drug in a clinical trial.
You could easily calculate Cohen’s d (there’s code in the blog post to do it) and report on it.
Cohen’s d measures the difference between the mean from two Gaussian-distributed variables. It is a standard score that summarizes the difference in terms of the number of standard deviations.
And the score is standardized:
- Small Effect Size : d=0.20
- Medium Effect Size : d=0.50
- Large Effect Size : d=0.80
Based on your data, the effect size between Mish and ReLU seems to be large (1.6 if I’m not mistaken), which is pretty good!
1 Like
This is really helpful. Thanks for this. I am currently increasing my sample size to 23 from 3 for the p-value calculation. Should I do Cohen’s d score calculation on the 3 samples or on the 23 sample set?
Thank you Diganta.
I think you can use it with both, but if you can claim the same results with 23 samples, it would be much more credible IMO.
1 Like
Alright. Would take some time though. For each activation 20 more samples will take 4 hours - 4.5 hours. 24 activations in total. So that will be around 96 hours which will be like 1 week max.
Maybe you can run the additional 20 against the activations that are closer to Mish in your previous results to see if they still look similar.
Would be unfair in my opinion. I want to have as constructive results as I can. Though yes, I’ll first run the ones which are significantly closer to Mish but eventually will do for all.
1 Like
Why would it be unfair? The calculations are based on your given sample size, that’s kind of the point is to allow accurate estimation of true (population) statistics given your sample size.
You might want separate tables for an evaluation of all of them with a smaller sample size and then a more detailed analysis of the top performers with more runs to simplify reporting but I think a comparison across different sample sizes isn’t unfair.
My suggestion would be you might be better to include confidence intervals rather than significance. The CI will give information on both the statistical significance and the effect size while being less liable to misinterpretation by those not familiar with statistical inference. For instance, people might think a lower p-value is indicative of better performance or that a high p-value means more runs are needed, which are both misguided views. There is a move away from significance testing in various areas of academia (mostly psychology and social sciences) with various journals no longer reporting p-values.
1 Like
I think more runs will clarify things! Thanks for doing all that work.
I’d like to see Mish, ReLU, Swish when you have them, as a start.
Also I agree with moving to confidence intervals. I believe that would help with the practical significance issues.
2 Likes
I have question about MXResnet implementation.
in MXReesnet class we have
blocks = [self._make_layer(expansion, block_szs[i], block_szs[i+1], l, 1 if i==0 else 2, sa = sa if i in[len(layers)-4] else False, sym=sym)
for i,l in enumerate(layers)]
so, Q about
sa = sa if i in[len(layers)-4] else False
as len(layers) always 4, we have SelfAttention module only in first block? and only in third ResBlock?
1 Like
hi Andrei,
I’m the author of the SimpleSelfAttention module and of the placement in the xresnet. Note that it’s still very experimental.
I believe you are right about the placement of the SelfAttention module. Feel free to experiment with other placements!
Let me know if you have other questions.
Got it.
I just won’t clarify, what you put in in 1 place, at the and of 1 block.
Ok, will try variants.
Input size to the layer will change if you move it so it should have an impact on speed.
Also, I’ve found that you need to place the attention layer after a conv_layer that uses “zero_bn=True”. Seems to help a lot with convergence.
1 Like
@TomB completely agree with you, but I just personally want all activations to have tests with all same parameters which includes sample size even if they are not close to Mish.
@Seb Thanks for all the suggestion.
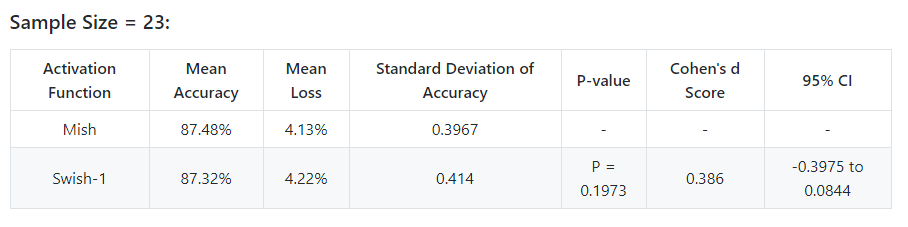
Just got over with the 23 batch run for Mish and Swish. Mish so far has the lowest mean loss, lowest standard deviation, highest mean accuracy.
@TomB @Seb - would be glad if you could provide your thoughts on this.
@oguiza as of right now Mish against Swish falls in the small sample effect - medium sample effect range for Cohen’s d score.
Variance has gone up for both (shows that there was something wrong with sample size = 3 variance), so it gets harder to tell them apart in terms of accuracy.
I plugged your values into https://www.medcalc.org/calc/comparison_of_means.php and get very slightly different values (could just be rounding).
Assuming everything stays the same (it won’t), you’d need more than 50 samples of each to get to p<0.05 and a 95% CI that is not crossing 0. That’s a lot of work!
Possibly it will be easier to tell Mish and ReLU apart.
Also, one thing with the comparison of means test is that you don’t need to have the same sample size for both types. So you could have 23 for mish and 10 for e.g. PreLU.
Is mean loss based on your loss function? When working with imagewoof, I found that loss has less variance and therefore gives better p-values and tighter confidence intervals. IMO it’s worth looking at loss if you find that accuracies are a bit close to each other.
2 Likes
50 samples will probably take me an eternity haha. I can do for loss too, I have all the data saved so that won’t be an issue. I will make another dedicated table for the loss tests. Thanks!
And yes, the slight difference in values you got is because of the rounding up in the table. All the values were calculated to complete precision. Just to make the table compact I wrote the values after rounding them up.
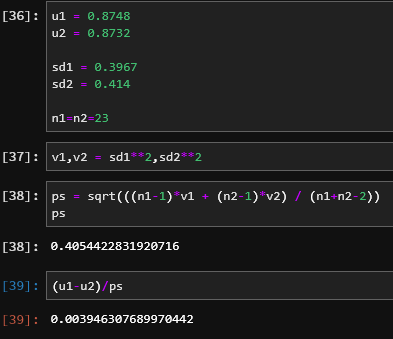
Off to bed, will have a better look tomorrow. But that Cohen’s d seems odd (though I’m not really familiar with it and my inferential stats is all a bit rusty). But I wouldn’t expect a non-significant result to be considered a medium effect. Are you mixing mean/sd between percent and not (i.e. 0.8748 vs 87.48)?
That’s seems better for a non-significant result.
@TomB Calculated the Cohen’s D score using this tool - https://www.socscistatistics.com/effectsize/default3.aspx
I didn’t completely get you on this:
Are you mixing mean/sd between percent and not (i.e. 0.8748 vs 87.48)?