Using that page I get the value you gave if I enter the means as 87.93 and 87.86, but the one I gave if I use 0.8793 and 0.8706. Is the SD off of percentages or raw values? I think either should be fine as long as you use the same for both (hence the “mixing mean/sd between percent and not”).
The SD is off the percentages (87.93 and 87.06)
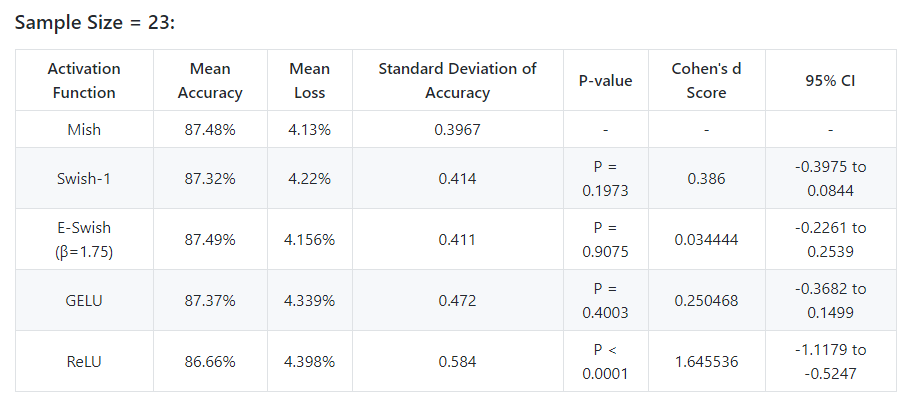
First of all, I think the result is very good, but may not be as good as expected. It’s difficult to show superiority to all other activation functions, but Mish seems really competitive.
What you could do to try to show statistical significance as Seb suggested is to calculate the minimum sample size. I would expect it to be small for most activation functions, except for Swish, and maybe 1-2 more.
As to the Cohen’s d score, I think the’re something wrong with the calculation. With that difference in accuracy and the standard deviations, I would also expect an effect size lower than .386.
1 Like
How to get the minimum sample size? As far as I know, we can get minimum sample size based on CI which has been already calculated.
Also can you take a look at the Cohen’s d score calculation, I’m using the web tool I had posted earlier.
Actually I think that probably is the correct calculation it’s just that the small/medium/large aren’t especially meaningful. Well, not quite correct, cohen’s d is apparently biased for small sample sizes (<50) and a corrected version should be used as noted in https://scientificallysound.org/2017/07/27/cohens-d-how-interpretation/ which just point to the R implementation while https://www.statisticshowto.datasciencecentral.com/cohens-d/ has a formula though it isn’t quite clear if the N is supossed to be the sample size of both groups or per group (cohen’s d is also biased for non-equal groups so could maybe be per-group). It gives a slightly lower but similar value of 0.36 or 0.37 (for N of 23 or 46).
That page also show overlap graphs which show ~0.4 isn’t that large an effect (https://rpsychologist.com/d3/cohend/ has a nice interactive one). A d of 0.4 means that about 60% of the time a randomly sampled member of the treatment group will have a higher score than a randomly chosen control group member so not that big a difference.
I’m not really sure if cohen’s d is appropriate in this context as opposed to the treatment context it seems primarily intended for. Looking around there’s also stuff about some fairly strict assumptions underlying it which may not be met here and even when appropriate it seems it’s not necessarily the best regarded measure of effect size.
1 Like
When we are designing an experiment in the natural sciences, a common initial step would be to do a power analysis - https://en.wikipedia.org/wiki/Power_(statistics) - to get some idea of the number of samples or repeated trials needed to detect some effect size. For these kinds of tests, eta-square is probably a good choice for measuring the effect.
I’m not sure how you are calculating the p-values, but if you can put together 10-15 runs of each condition a simple t-test should be sufficient if the data is normally distributed.
Awesome thread and amazing work! Keep it up!
1 Like
@TomB thanks for those insights. That was really helpful. I was wondering after all what is the best test to do to have some readings based upon to confirm significance.
@Interneuron Thank you for those suggestions. I’m calculating the p-values as per given here - https://www.medcalc.org/calc/comparison_of_means.php
All thanks to @LessW2020 for this awesome thread.
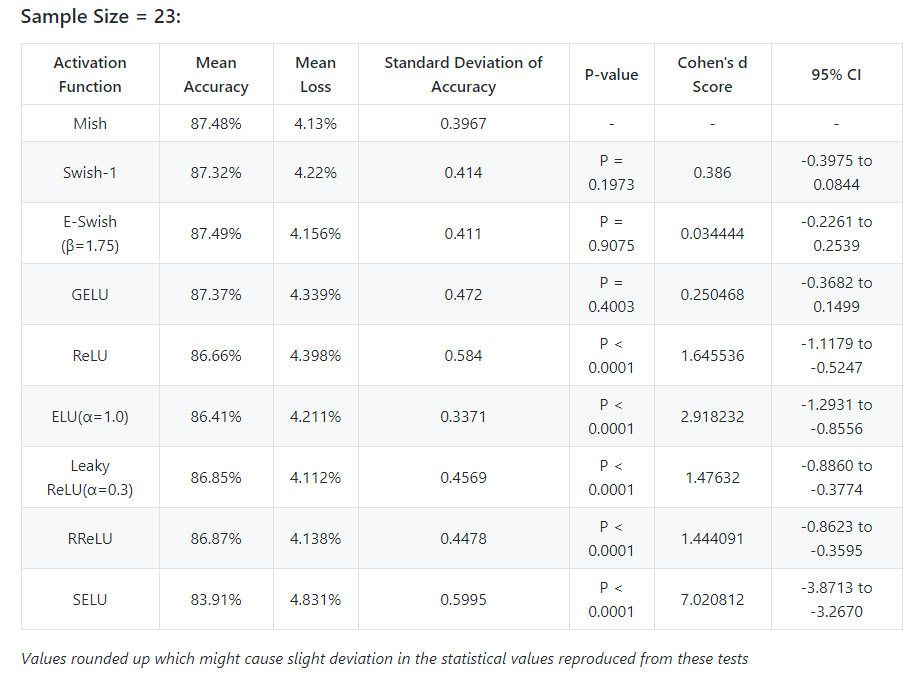
@Seb @oguiza the results for ReLU looks absolutely great for the 23 sample run.
1 Like
That’s not really how p-values work. There is no number of samples you’d need to achieve a given p-value. You can, given a minimum difference you want to be able to detect determine the sample size you’d need to detect such an effect with a given error rate (through a sample size/statistical power calculation). The p-value specifies the acceptable possibility of a type-I, false positive, error, thinking there is a difference when none exists (you also set the acceptable type-II, false negative, error rate, missing an effect that is there). But you don’t set out to achieve a given p-value as that would assume there was a significant difference to begin with which is the very thing you want to test.
Gathering more samples on the basis of an initial significance test invalidates the significance testing, undermining it’s use. I think you can understand this intuitively in terms of classic multi-event probabilities (without getting into the complicated issues around correctly interpreting probabilities in statistical statements). If you perform a significance test with a p of 0.05 you are allowing for a 5% chance of a type-I error, giving yourself a 95% chance of catching any such type-I error. But if upon failing that test you then add more samples and perform another p=0.05 test, then you actually end up with only a ~90% (0.95*0.95) chance of detecting a type-I error not the putative 95% of your chosen p-value (I think the true statistics are more complicated because these aren’t independent events, and I don’t fully understand the details, but I think this shows the basic idea). So you weaken your error checking by repeating tests ad-hoc like this as the statistics assumes the tests are pre-planned and not repeated. There are different tests you need to perform in the case of post-hoc analyses which take the issue of repeated tests into account (though these tests don’t tend to cover this particular case, they tend to be for when you perform additional post-hoc t-tests for additional hypotheses rather than repeating the same hypothesis test with more samples).
Increasing your sample size until you obtain a significant difference is a kind of p-hacking and is poor scientific practice. This being one of the reasons some areas are moving away from p-value based significance testing. Setting a specific boundary between significant and non-significant results can encourage poor research practice trying to cross this arbitrary line and doesn’t actually aid much in understanding the results of experiments.
In this case it’s not clear to me that much more than a confidence interval is really needed. In other cases things are more complicated. You may need to be quite certain of even a very small difference and want to compare quite different samples or populations. E.g. in medicine a very small effect size of a treatment could save a lot of lives when extended over many patients and you may want to compare different treatments (for the same or different conditions) on different samples from different populations (in terms of the variability of outcomes). These are the sorts of issues that make things like Cohen’s d important. But they don’t seem to really apply here. Your samples should be random and representative and the SDs are fairly consistent between the activations so direct comparison of the accuracy percentages should be a pretty reliable guide to effect size.
A simple CI for each activation (including Mish, CIs aren’t dependent on t-tests) would seem to accurately quantify the expected range of values in continued applications (the population), given your necessarily limited testing (the sample). The results of a significance t-test can be easily inferred from the CI if the reader desires and the CI should be generally understandable even if not familiar with inferential statistics. In fact even CIs don’t seem typically reported in the literature with many papers not even giving the SD for results (I wonder if this is because they would not be particularly favourable in many cases). So even just adding in SDs and CIs would seem to be going beyond what is typically done.
4 Likes
This is such a great conversation. I believe the machine learning community really needs to improve on how they report results and this is a great start.
Thank you Tom for setting me straight regarding p-hacking.
With individual CI’s, is there a risk of CI hacking if you decide to increase your sample size to refine your CI’s? I would think yes, if you are targeting a result such as non overlapping CI’s between two activation function.
1 Like
@TomB Thanks for the clarification and insight. Really helpful indeed, cleared a lot of air around p-value and significance tests in general. So as far I got it, you are suggesting to just validate by using CI. I have updated the 23 sample table, please do provide your insights on the same:
2 Likes
Nice work!
I think Tom suggested using individual CI’s as opposed to CI’s that are relative to Mish. I like that idea.
I would also like to see CI’s for loss (also please specify which loss you are using)
1 Like
I’m working on a similar project of comparing model A to model B and having to try to make a fair comparison.
One issue is that training epochs with model B are a bit slower to run (e.g. 5-10%). So I want to be fair in that realm as well.
I’m not sure what an elegant way to deal with that is, but I got the idea of not running all batches for each epoch for the slower model. Better than my previous idea of running fewer epochs with the slower model.
I can now compare models with any number of epochs, but with equivalent epoch runtime.
This could be useful when evaluating models such as MXresnet if they happen to be a tad slower.
This is the callback that I’m currently testing (seems to work).
1 Like
@Seb @TomB will this be fine to calculate individual CI - https://www.socscistatistics.com/confidenceinterval/default3.aspx
Also @Seb, regarding the loss, I’m using Categorical Cross Entropy.
Hi Seb,
Personally, coming from the marketing world, I believe the “best” solution to a problem rarely exists. It all depends on what you value most in each context. Do you prefer the fastest car, or the safest, or the cheapest, …?
In ML there are many factors you may consider, like accuracy, speed, complexity of the solution (Netflix competition winner), inference time, etc when choosing a soliton to a problem.
So I believe, the best approach is to try to describe our solution as best we can so that potential users know what to expect.
I have a small dataset where any improvement in accuracy is important (within reason). My models run quickly, so a 20% increase in time may not be significant.
Being practical in your case I would compare them in terms of efficacy (performance for the same number of epochs) and in efficiency (performance for the same amount of time).
2 Likes
Thanks for the great discussion here!
This could be a interesting starting point for people who want to dig deeper into statistics:
https://www.nature.com/collections/qghhqm/pointsofsignificance
(It says “Statistics for Biologists” but the basics are universal. They have nice small chapters which cover the basics of different aspects of statistics.)
1 Like
I agree to this. The reason being that many people have dismissed Mish because it comes with an additional computational overhead but again:
- Nothing can be as fast as ReLU
- Mish gives higher accuracy and more stable loss
So it’s upto users to choose which side of the trade-off (higher accuracy or faster inference)
Again, many companies who have deployed models with one time training would prefer something that gives better accuracy. For instance, if Mish could be used to prepare an ImageNet trained model with best loss that would be obviously preferable to use for transfer learning.
2 Likes
Spot on. That’s the reason why I’ve added Mish to all my models for this small dataset problem. Because for me, in this problem, accuracy is critical. But we need to understand pros and cons to be able to make a good decision.
1 Like
Good question, I guess sort of yes and no. No in that with a CI you aren’t doing a specific hypothesis test by setting an arbitrary line to count as significant. Though yes in that as you say you could just choose a particularly good CI. The maths of CIs is pretty similar to that of t-tests, they both estimate population parameters based on your sample mean and SD given a normal distribution (well, a t-distribution as noted below). Certainly if you just replaced the importance of significance on a t-test with having non-overlapping CIs you’d invite the sorts of unintentional manipulations that contribute a lot to the p-hacking/reproducibility issue.
Yeah, I’d think just a CI should be fine given that there isn’t a big use of more advanced statistics in the literature, even in comparison studies like this (and even studies that are purely comparison based, not introducing anything new). You can also do an interval plot of CIs which should be quite intuitive. Such a plot is pretty much giving the range of accuracies you should expect from 95% (or whatever CI you use) of the time (I think, there’s lots of complexities in the interpretation of statistics even without getting into things like frequentist vs. Bayesian approaches). It’s a bit of work to do them in matplotlib and needs formatting work but something like:
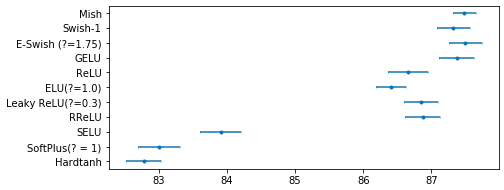
(I’ll post the code in a separate post as it’s in a notebook with other stuff but it’s error bars on a line plot with the lines styled out)
As noted on that page the Z statistic it’s using is not accurate for small sample sizes. So you probably still want to use t-based confidence intervals as on Confidence Interval Calculator: Single-Sample T Statistic (which should be the same calulation as on the t-test page you were using before, but without the comparison to a second mean). The t-statistic is based on Student’s t-distribution which is a modified normal distribution taking into account small sample sizes so you look up the appropriate t-value for your sample size in a table and it gives a correction parameter for your formulas.
3 Likes
Tensorboard has a feature to show you metrics over time rather than steps which might be nice for such cases (steps being a value you provide, I use iteration (batch) from FastAI’s callbacks). Not the best data for it, just what I’m working on, but this is it’s plot of loss across relative time (xticks are hours here, pretty long runs):
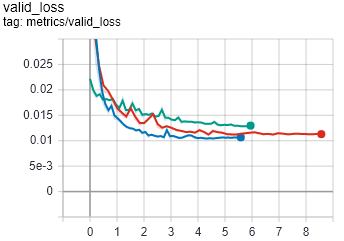
You can switch between steps and either relative or absolute time.
There’s also some nice hyper-parameter stuff in tensorboard that could be useful for these sorts of comparisons (more so for things like the optimiser comparison then here where there’s only really one hyper-param). Unfortunately it’s not supported in the PyTorch version, I’m looking at adding it (mainly just sending the data, though it’s more complicated than most other things which are just sending a scalar/graph etc).
2 Likes
I had a bit of a look at the Mish performance:
No gains but some analysis. I tried the PyTorch JIT compiler stuff but it didn’t improve performance. They’re still working on this I think with some things like CUDA kernel fusing still being developed, so it may improve in future version. It does let you see the graph of forward and, more interestingly, backward passes which is nice.
From the profiling a big issue is the increased number of kernel launches (mul/tanh/softplus vs. a single kernel for relu). Though rather surprisingly the slowest kernel by quite a bit is the multiplication. It goes from 3ms of CUDA time with Relu to nearly 7s in Mish (including forward and backward), more than tan and softplus combined. Not sure what’s going on there. Best guess is either it’s hiding some operations, being the first operation in the backward pass, or it might be poorly optimised. I’ve seen things noting some of those very basic ops haven’t been updated since Caffe which PyTorch is(/increasingly was) built on. I’ll try addcmul in case that’s better optimised.
I also played a bit with some of the autograd stuff, as it looks like using that would let you inplace operations (by making a torch.autograd.Function) but means you have to do the backward yourself. Anything inplace causes an error in a nn.Module. My calculus is very limited so not sure I’ll make much progress there, but others with better maths might. Not very well documented but I’ve put in some of the stuff I found.
Implementing a custom backward would also be needed if you wanted to implement a CUDA version as you can’t really re-use the tanh/softplus there (that would require a separate kernel launch which gets you back to the straight PyTorch case). I’ve played around with CUDA stuff a bit so could help with that if others with better calculus want to try.
3 Likes