I came across Chris Moffitt’s starter code to generate waterfall charts in Python 3. His example is particularly useful because he doesn’t assume Excel files as input (as the other finance oriented python waterfall chart starter codes do), but rather deals with pandas data frames exclusively. As a starting point, I think his chart looks pretty good.
The code could use a little tweaking (color coded contributions vs deductions, thinner connecting lines…) and if anyone with a little more programming experience wants to help me build a decent python function out of all this [ waterfall_chart(input) ] please feel free to contribute to this repo.
Oh this is exciting! If it’s at least somewhat working now, you should create a setup.py file upload it to pypi so all can use it, and you can get maximum credit! Good practice to learn how to create and submit python packages too, IMHO.
I’ve gone ahead and implemented the above methodology into 2 function calls:
waterfall()
waterfall_money()
I’ve also uploaded a package to PyPi that enables you to make the same quick waterfall charts. Please be mindful that updates are along the way (improved colors, notably), but for now please feel free to use what I’ve assembled, notably to visually represent random forest decisions as used for in lecture!
Guide
pip install waterfallcharts
to your file imports add from waterfallcharts import quick_charts as qc , for example
Usage
As detailed in the example and source code, the function assumes two list inputs, one of the contribution NAMES and the other of the contribution AMOUNTS. Please note that the NET SUM of all contributions is not an input to the function, and is calculated for you.
This took me a while to put together, and if anyone else is having trouble figuring out how to upload their first package to PyPi, a combination of the following links were of great help to me:
Not sure you need the separate waterfall_money function? Perhaps instead just have an optional format string passed to the function to format numbers? https://pyformat.info/
Also, would be nice to fix up the readme, and clean up some of the unused files in the repo - I’d like to share this on twitter once you feel it’s ready…
Thank you for the feedback Jeremy! Yes, agreed an all your points. I’d also like to include other features as well, to make the first release version as useful as possible for now. Will coordinate with others to improve
Just a little update I’m working on… bug fixes and customization mostly. The chart is now pretty robust and handles all sorts of data edge cases. You can expect to pip install the latest version tonight! Also now supports custom formatting of the tick labels, and bar colors, given as function arguments.
BTW I spoke to @yyun2 today about adding a feature to optionally sort the contributions by absolute value, and also if you have a lot of features, to optionally put all the smallest contributions into a single other category. Hopefully she’ll be able to give you a PR with that functionality soon…
Well @jeremy, through the custom formatting argument people are now free to make that mistake but thanks for spotting, won’t be using that chart in the readme!
UPDATE: the permanent repo for this package is now here - this location is no longer for exploration and monkeying around, and is permanent. Please feel free to add Issues and pull requests to this repo starting tomorrow morning! the time I need to finalize my changes and release the update.
Hi guys,
We officially have two new features for the waterfall chart! We can sort contributors by their absolute values and we are able to set a threshold and group all relatively insignificant contributors together. Hope you all find it useful and enjoy it!
Very nice! Be sure to update the readme file to show pictures and code explaining how to use the various features in this library, including the new features you added.
The more context you can provide explaining not just how to use the features, but why you’d use the features, the better. That generally means trying to come up with some good example data - e.g. using one of the sklearn datasets.
@jeremy I believe I am done working on this for now. It should be robust enough as a good matplotlib waterfall chart in both Python 2 and 3. @yyun2 if you still feel like adding the sklearn example I would happily hold off publishing until you’ve got that figured out.
Please do let me know if you think the repo is shareable! My twitter handle is @chrispaulcs
 MSAN UNITE
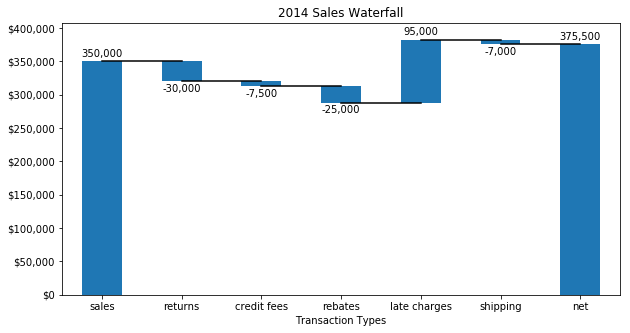
 Good practice to learn how to create and submit python packages too, IMHO.
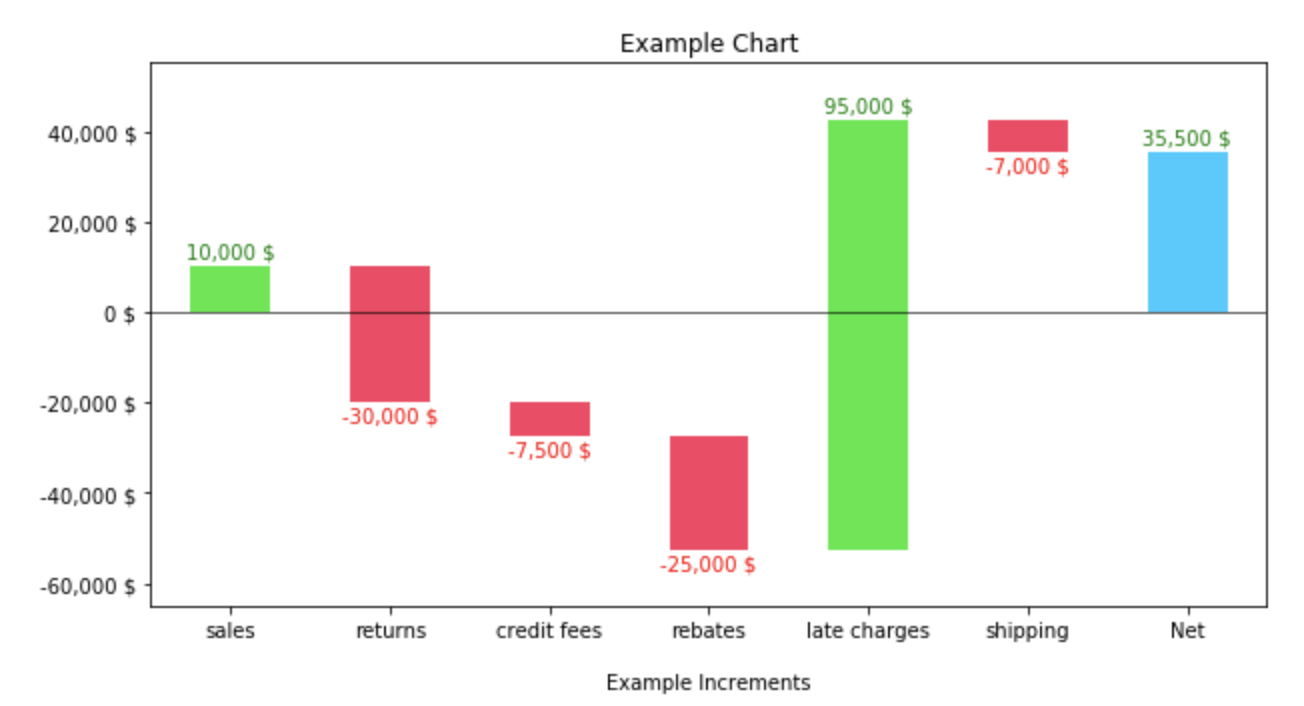
 but thanks for spotting, won’t be using that chart in the readme!