Made a couple of updates to the visual GUI (originally from this post: Visual GUI particularly focusing on the confusion matrix. Confusion Matrix results can be found under the ‘results’ tab once a model has been loaded.
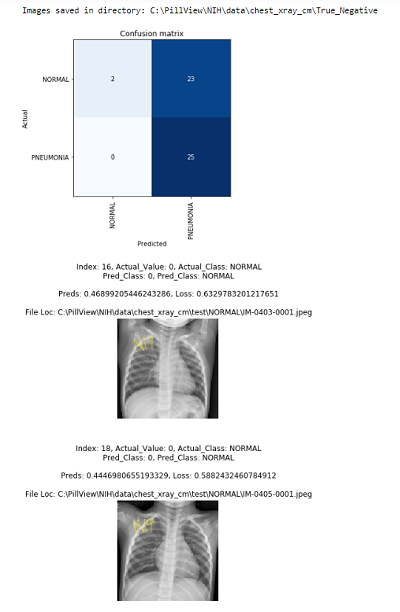
Currently the confusion matrix looks like this:
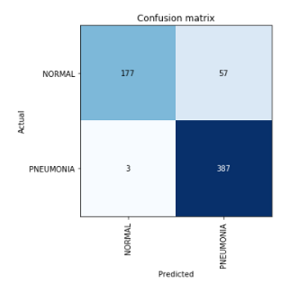
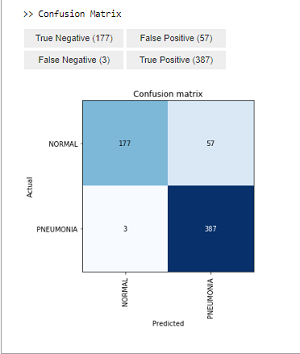
No option to get any additional information about the images that correspond to the values within the matrix. Updated version includes clickable tabs for each section of the matrix.
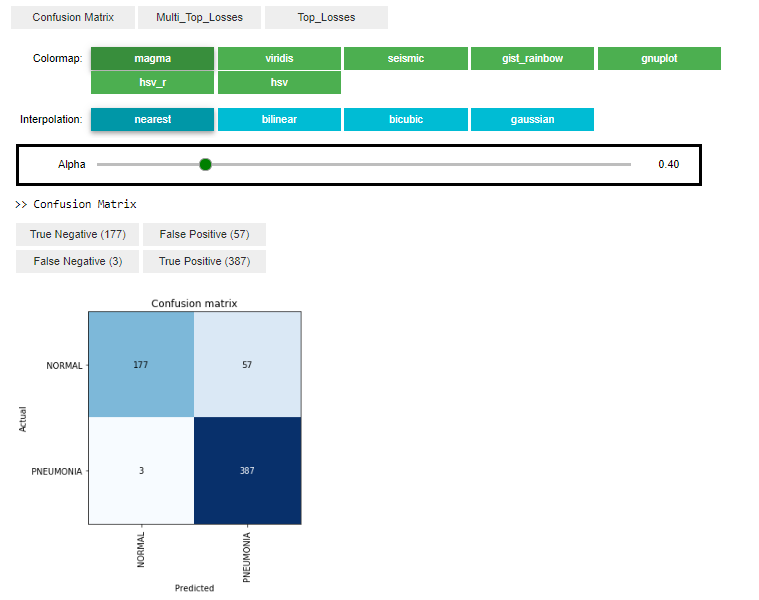
With the option to now chose whether to include heat-maps or not.

If the heat-map option is chosen you have the ability to tweak the type of color-map used, the interpolation and the alpha value).
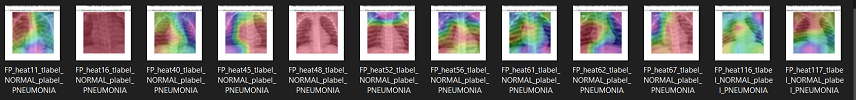
A number of examples of how the images look using various heat-map options
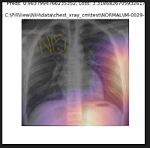
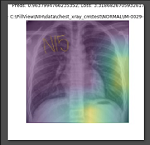
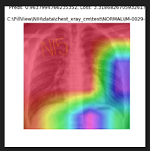
Images are stored within their respective folders and color map pictures can be viewed within these folders:
False Positive:
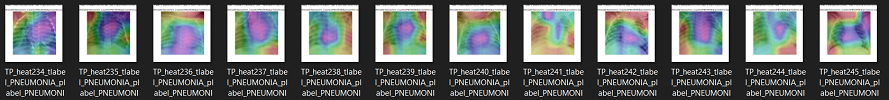
True Positive:
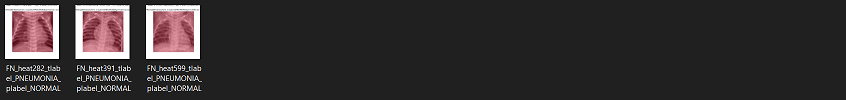
False Negative:
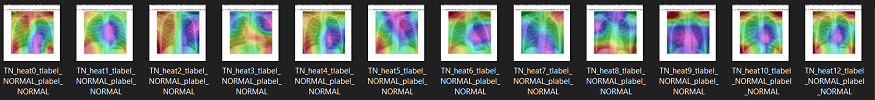
True Negative:
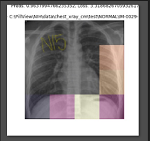
As well as the option to view images without the color-map option providing the file location, ground truth label, predicted label and loss value:
I am hoping that this is a useful feature for data visualization and currently only works with 2 labels. the code can be found under Visual GUI on my github page: https://github.com/asvcode/Vision_UI


