Hi all, I just started the course. I’m excited to see where it takes me.
In parallel with this course, I am working on my first Kaggle competition. I based my first submission off of a tutorial I found, and am now working on version two. The first tutorial used feature engineering to create a “Title” feature that ended up adding value.
In version 2, I engineered a “Deck” feature from the existing “Cabin” feature. Unfortunately, there are 1015 missing cabin entries. I decided, after some research into the ship layout, to plot the distribution of decks based on ticket class. This graphic is what I produced to visualize the relationship:
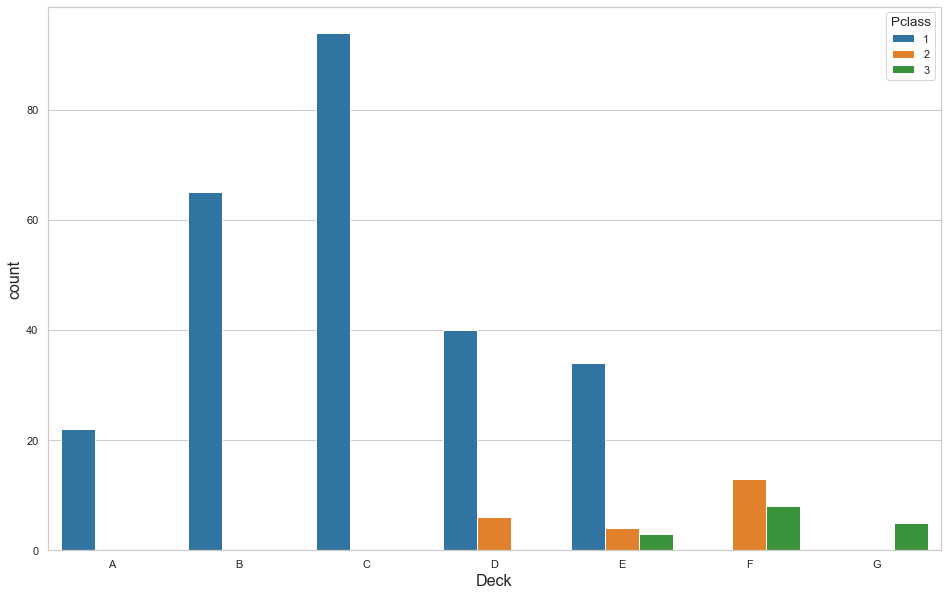
Based on this, I came up with some rough probabilities of where to fit the missing data:
# rough estimate of weights based on graph:
choice_dict = {
    1: [['A', 'B', 'C', 'D', 'E'],
        [.12, .22, .32, .20, .14]],
    2: [['D', 'E', 'F'],
        [.16, .34, .50]],
    3: [['E', 'F', 'G'],
        [1/3, 1/3, 1/3]]
}
And applied it like so:
for key, value in choice_dict.items():
    m = (joint_df.Pclass == key) & joint_df.Deck.isnull()
    num = len(joint_df.loc[m, 'Deck'])
    fill_in = np.random.choice(value[0], size=num, p=value[1])
    joint_df.loc[m, 'Deck'] = fill_in
I thought I was being clever, but this caused all of my metrics to drop by about 3%. I’m just looking for some insight into why that might be. I don’t know how to ‘tune’ a model yet, so I figured my best bet for improving scores is working with the pre-processing of the data.
Any insights appreciated.