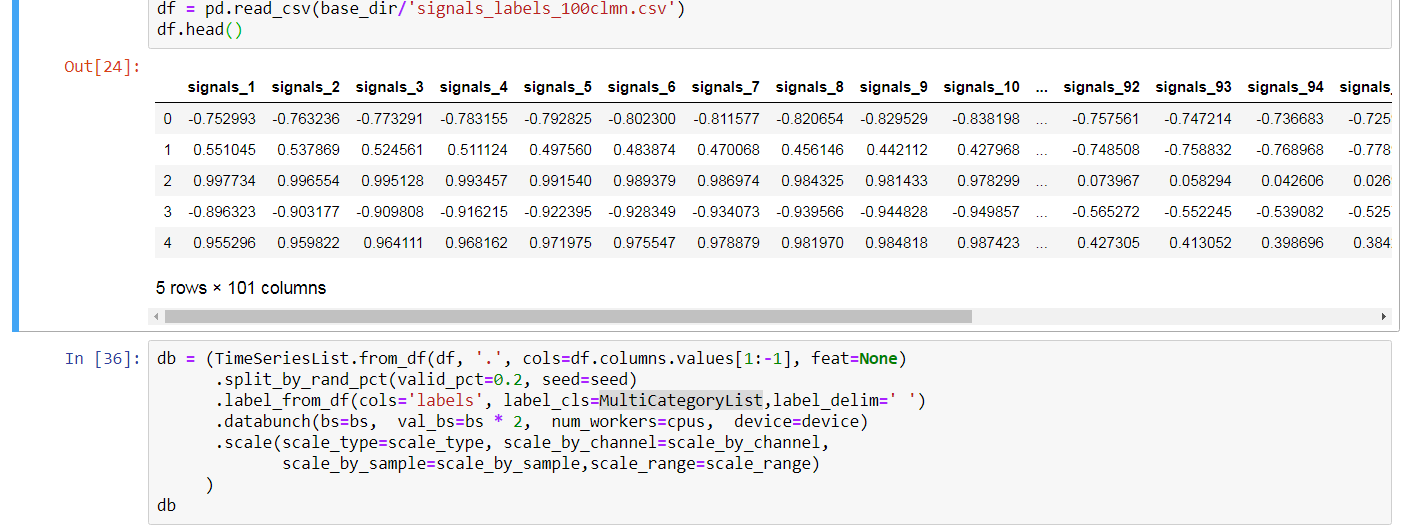
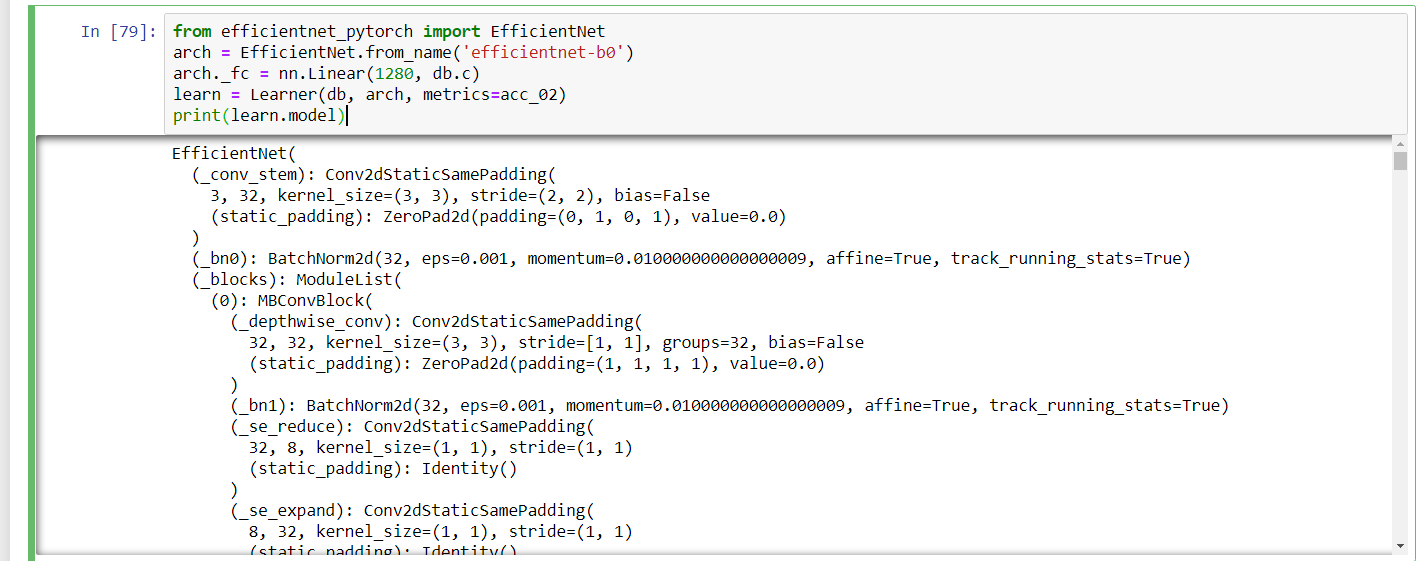
For regression I am using a very similar ItemLists as @oguiza timeseries library.
The only thing you need to do is change the loss_func to L2 or MSE.
So you need a LabelList where x’s are timeseries and y's are floats. Then a Learner with a compatible loss_func, the network is exactly the same. My code is something like this:
def curves_from_arrays(X_train, y_train, X_valid, y_valid, label_cls=FloatList):
    src = ItemLists('.', IVCurveList(X_train), IVCurveList(X_valid))
    return src.label_from_lists(y_train, y_valid, label_cls=FloatList)
#reading from numpy arrays
data = curves_from_arrays(X_train, y_train, X_valid, y_valid, label_cls=FloatList)
The data is x is a timeseries (an IV curve with 2 channels Voltage and Current) and the y are 3 floats. (I am regressing on 3 values)
>>data
LabelLists;

Train: LabelList (162176 items)
x: IVCurveList
IVCurve(ch=2, seq_len=200),IVCurve(ch=2, seq_len=200),IVCurve(ch=2, seq_len=200),IVCurve(ch=2, seq_len=200),IVCurve(ch=2, seq_len=200)
y: FloatList
[ 0.596429 -0.778986  2.887455],[ 0.191421 -0.728332 -0.999715],[ 0.766844 -0.152139 -0.545443],[-1.48883   0.756254 -0.743682],[ 0.776515 -0.732029 -0.526256]
Path: .;

Valid: LabelList (18020 items)
x: IVCurveList
IVCurve(ch=2, seq_len=200),IVCurve(ch=2, seq_len=200),IVCurve(ch=2, seq_len=200),IVCurve(ch=2, seq_len=200),IVCurve(ch=2, seq_len=200)
y: FloatList
[ 0.530938 -0.308305 -0.074202],[-2.674041  0.203413 -0.858775],[ 0.75456   0.636721 -0.159548],[0.762624 0.798379 0.160289],[ 0.74852  -0.539873 -0.589922]
Path: .;

Test: None
Then we put everything on a DataBunch
#on a databunch
db = data.databunch(bs=1024, val_bs=2048, num_workers=10)
#the network
model = create_inception(2,3)
#the learner
learn = Learner(db, model, loss_func=nn.MSELoss(), metrics=[mean_absolute_error, r2_score])
et voila!


