Hi again!
Another noob question. How do these algorithm deal in general with missing values? Are there missing values in the UCR database?
Hi again!
Another noob question. How do these algorithm deal in general with missing values? Are there missing values in the UCR database?
I have been playing this morning with a 1D implementation of Res2Net from here. But the more I play with UCR the more I dislike this benchmark. It has so little training samples for some tasks that I am not sure if we could create a model that performs well. How I see it:
SmallKitchenAppliances that has 375 samples we get this only after 40 epochs:
|                              |   res2net |
|:-----------------------------|----------:|
| Wine                         |  0.979167 |
| BeetleFly                    |  0.85     |
| InlineSkate                  |  0.429091 |
| MiddlePhalanxTW              |  0.61039  |
| OliveOil                     |  0.9      |
| SmallKitchenAppliances       |  0.792    |
| WordSynonyms                 |  0.587774 |
| MiddlePhalanxOutlineAgeGroup |  0.62987  |
| MoteStrain                   |  0.829872 |
| Phoneme                      |  0.241561 |
| Herring                      |  0.671875 |
| ScreenType                   |  0.613333 |
| ChlorineConcentration        |  0.853125 |
Indeed it is a very hard problem, it is not straight forward to obtain labeled data for time series classification. That’s why deep learning has just started being explored for this task.
We need an Imagenet, this UCR dataset is bad and small.
I would use the word hard and challenging instead of “bad” 
The people who gathered and prepared the archive spent a huge effort which led to this advancement of time series classification algorithms.
I agree that it’s very frustrating sometimes! 
But I have to say that it is no different from other real life datasets.
The one I use only have aound 1000 samples, and I can tell your it’s equally frustrating!!
The good thing is that when you deal with very challanges datasets, you end up trying so many things, that you learn a lot.
And there are really small datasets (like OliveOil), where you can get a very high accuracy (in some models I’ve used 96%+) with only 30 samples (levereging image encoding and transfer learning).
I’m still convinced we can beat HIVE-COTE and TS-CHIEF using this dataset!
I am implementing exactly your metrics @oguiza to be able to compare accurately.
I’ve also been testing Res2Net 1D, and similar large vision-like models in the past.
One of the key learnings I got is that those models tend to greatly overfit, and don’t work so get.
After some thought I think I understand what the issue might be.
If you think of it a 224x224x3 has around 150k pixels. ResNet50 has around 25M parameters.
We are dealing with TS that tend to be small in size. It’s pretty usual to have TS data with less than 1k datapoints in total (nb feats x seq_len). So this is 1% of a normal image.
This is the nb parameters for some of the 1D models we usually use with TS:
But the versions I built of Res2Net are pretty big in comparison:
So these ones may work well in case you have lots of data, which I haven’t been able to try because I don’t have.
What do you think?
Ok.
I’m a bit confused when you say you are applying mixup. I thought you said yesterday that probably fastai’s mixup didn’t work. What are you using then?
I am using fastai Mixup  It works, but not yet sure if it performs good enough.
Here are the results for Res2Net50:
|                              |   epochs |        loss |   val_loss |   accuracy |   accuracy_ts |   max_accuracy |   time (s) |
|:-----------------------------|---------:|------------:|-----------:|-----------:|--------------:|---------------:|-----------:|
| Wine                         |      100 | 0.0472185   |   0.836495 |   0.75     |      0.75     |       0.895833 |         52 |
| BeetleFly                    |      100 | 0.000209084 |   1.11402  |   0.8      |      0.85     |       0.9      |         61 |
| InlineSkate                  |      100 | 0.0516765   |   2.72746  |   0.42     |      0.42     |       0.423636 |         98 |
| MiddlePhalanxTW              |      100 | 0.000941262 |   2.88568  |   0.532468 |      0.551948 |       0.571429 |         97 |
| OliveOil                     |      100 | 0.292994    |   0.38972  |   0.9      |      0.9      |       0.9      |         68 |
| SmallKitchenAppliances       |      100 | 0.00445449  |   1.60318  |   0.741333 |      0.741333 |       0.778667 |        105 |
| WordSynonyms                 |      100 | 0.00383701  |   3.29962  |   0.534483 |      0.532915 |       0.543887 |         84 |
| MiddlePhalanxOutlineAgeGroup |      100 | 0.00181109  |   3.13823  |   0.493506 |      0.493506 |       0.623377 |         92 |
| MoteStrain                   |      100 | 0.00239903  |   1.1964   |   0.744409 |      0.744409 |       0.794728 |        694 |
| Phoneme                      |      100 | 0.00118895  |   5.0102   |   0.224156 |      0.224156 |       0.244198 |        145 |
| Herring                      |      100 | 0.00332776  |   2.34432  |   0.546875 |      0.546875 |       0.65625  |         66 |
| ScreenType                   |      100 | 0.000509472 |   2.89669  |   0.482667 |      0.482667 |       0.581333 |         96 |
| ChlorineConcentration        |      100 | 0.00138494  |   0.806829 |   0.851823 |      0.851823 |       0.854427 |        196 |
How can I compute the number of params?
No there are no missing values. I gues you could delete some randomly if you wanted to try it.
I’ve never dealt with missing values to be honest with you. I don’t know if they would even work.
Usually you would replace those missing values with a constant, or an average, or median, etc.
Sorry I can’t help more.
I’d think you’d want an external preprocessing step in your data frame to handle this with the average. There’s a few different methods to it but I usually do the average, so here I’d do it over the particular series instance (row). That’s how I’d go about missing values in this case ![]()
Makes sense! I will make mean imputation then. Thanks!
How would you proceed doing so?
Timeseries core like notebook 40_tabular?TensorData one?DataBlock to read Timeseries?Best to ask these questions in the v2 thread you just created.
New notebook: Time Series Data Augmentation (cutout, mixup, cutmix)
As you know one of the best ways to improve performance (especially when a dataset is small) is to do some type of data augmentation.
In the last coupld of years some cutout, mixup and cutmix have appeared as very powerful ways to improve performance in computer vision problems.
I’ve created a notebook to show you how easily you can start using them. In many cases, performance can be improved. If you want to see how it works you can go to timeseriesAI and open notebook 03_new_Time_Series_data_augmentations.ipynb
I hope you find it useful in you time series problems.
I saw the notebook earlier today, is awesome! Let’s build core.series on fastai V2!
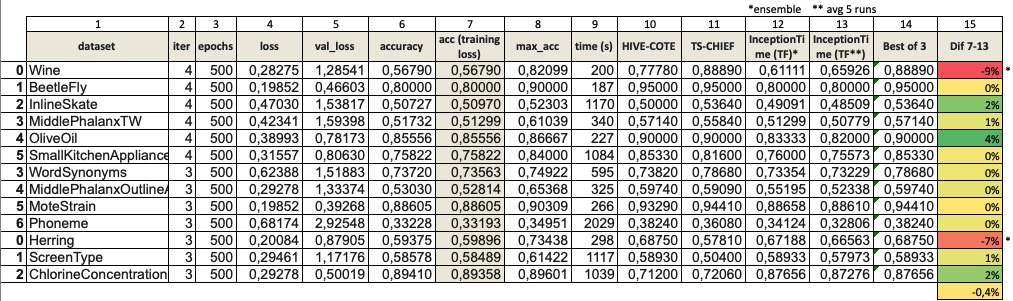
I’ve completed 3-4 runs of InceptionTime baseline after fixing the cone layer bias (thanks to @tcapelle for pointing that out). The results of 500 epochs are now better, and almost the same as the one @hfawaz has with the TensorFlow version with 1500 epochs. So I think it’s a good start. Here are the results:
You’ll notice that the average performance is very close in 11 datasets, but there are 2 where it’s actually lower (Wine: -9%, and Herring: -7% accuracy compared to the avg of 5 TF InceptionTime runs).
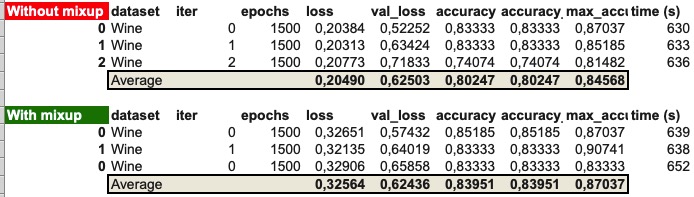
I’ve digged a bit more to try to understand why, and have run Wine for 1500 epochs (with and without mixup). There’s a huge jump in performance (+23% without mixup, and +27% with mixup):
All these performance results use the same architecture as the original in TensorFlow. I have not made any single change yet. Any difference would mainly come from the training process/ optimizer.
So a few comments:
Thank you very much @oguiza for sharing your fantastic work and inspiring some many people to get on board.
Thank you so much for your feedback Farid. I really appreciate it!
I just try to learn and contribute as much as I can