Time series/ sequential data study group

New time series kaggle competition out, prediction task (but single step it seems, so could be treated as regression problem or maybe using tabular too), maybe interesting for some here:

3 Likes

Thanks for sharing @marcmuc! It looks like a good opportunity to use some of he techniques we’ve been discussing here!

I’m currently working on a v2 example kernel to use, dealing with a few bugs but I’ll update when it’s all fixed and done :slight_smile:

1 Like

I’ve completed a couple more experiments with InceptionTime and mixup.
I believe they work pretty well together.
I’ve tested the Wine and ChlorineConcentration datasets (worst and best relative InceptionTime performance compared to HIVE-COTE and TS-CHIEF).
I run 1500 epochs (same as in Fawaz’s test). Here are the results:

Wine behaves much better when used longer, and especially in combination with Mixup. It actually get’s closer to the state of the art.

In ChlorineConcentration the results is even better, beating both HIVE-COTE AND TS-CHIEF by a large margin.

So in summary, it seems that time series models could really benefit from the addition of mixup.

1 Like

Hi, very interesting results thanks for sharing.

I found that indeed InceptionTime overfits very easily Wine.
I wonder did you test with other than those two datasets ?

Best

Thanks!
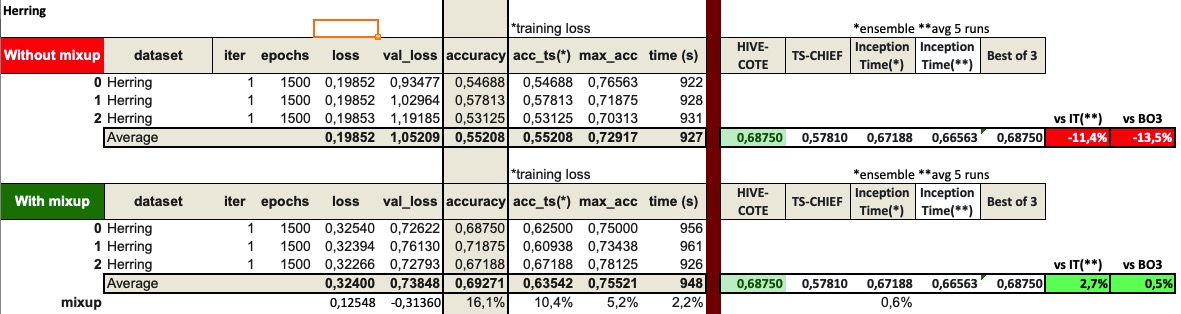
The only other one I have is Herring. The results with InceptionTime were also poor in comparison to HIVE-COTE and TS-CHIEF, and with the addition of mixup, it would beat both of them.

That’s all I have tested (and I’m not currently planning to run more tests as they take a considerable amount of computer time).

EDIT: I may run a test with the new BatchLossFilter if I can find some time. It’s a technique that can also be used with time series.

Okay great, so I understand that you are using your own implementation of InceptionTime in pytorch/fast.ai

Would you run your own Inception without the mixup to make sure that the improvement comes from Mixup and not from your implementation in fast.ai ?

What do you think? Does it make sense?

That’s exactly what I did, but I haven’t explained clearly :grinning:

I’ve always used my InceptionTime implementation and fastai.
In all 3 cases I’ve shared, I’ve included in red Without mixup, and in Green With Mixup.
I run 3 tests for each datasetset with 1500 epochs each.
The only difference between both sets of data is mixup. In all 3 cases, accuracy improves 3.7%, 3.9% and 16.1% when using mixup.

Okay thanks.

So it seems that without mixup you are not able to reproduce the Inception results from my repository ?

Well, they we pretty close I think (post).
I run InceptionTime on 13 datasets for 200 epochs.
Wine and Herrings were the ones with a big discrepancy. That’s why I run them for 1500 epochs.

Okay great, just wanted to make sure.
Thanks for this, I will let you know whenever I try mixup in keras.

Best,

1 Like

I made a very very basic example kernel using fastai 2.0 available here if anyone has questions let me know, I tried my best to explain what’s going on especially with the new library :slight_smile:

2 Likes

I’ve felt this way many times too… and I still do sometimes :smiley:
But I always end up applying Andrew Ng’s rule of thumb: DL can usually achieve those things a human can do in 1s.

So here are a few thoughts how I’d approach this type of situation:

  1. How have the samples been labeled? Does it take a human a lot of time to label a sample? Or are they visually easy to be labeled?

  2. The first step is to make sure your implementation works. To do that I usually:

    • use the training data (training + training instead of training + validation) in the DataBunch. In this way I can get training metrics. My goal is to achieve the goal I have in mind in training (even if it overfitting). This is to ensure my implementation is capable of learning.
    • I select a subsample of the training data. This is to accelerate the test, and be able to iterate quickly through many ideas.
    • Sometimes I select a similar UCR dataset with a known metric, to evaluate your set up is correct.

    With all this you’ll be ready to start running some quick tests with your data in a set up you know works well.

  3. Try several architectures: you are looking for one that can achieve the goals you have in mind with your own training data (still not using validation). I tend to choose the simplest one (fewer parameters) that achieves the goal, as it may be very difficult to avoid overfitting then. So I start with the smallest one (usually FCN, ResNet, etc).

  4. You also need to select LR and number of epochs. I’ve seen you’ve used 5 epochs only. In some problems (even with little data like OliveOil) it usually takes many more epochs (200) to get a good result. But you may not do that quickly if you don’t have a small data subset (one batch may be enough to try to overfit).

  5. With all this you may learn if any of your architectures is capable of learning a similar UCR dataset and a small subset of your training data.

Then I create a new databunch with the full training and validation sets, and see the results with the previous set up. Most of the times there’s a lot of overfitting, and that is your next task that is to generalize well reducing overfitting.

In my experience, this approach has an advantage, that is a mental one. It reassures me that there’s something to be learned, and that I’m working with a model capable of learning.

Please, @vrodriguezf let me know how it goes if you use this approach, aor you have any questions.

2 Likes

I cannot thank you enough @oguiza for your support, your repository and everything you are doing in general for the time series community!

You answer was really inspiring, I am gonna try a few things that you mentioned, specially the one related to test a similar dataset of UCR. Since my data comprises mainly physiological signals, I think I will choose the UCR datasets with ECG signals

From your experience, should I give more priority on the similarity on the train size, the time series length or the number of classes? I have 3 classes, thousands of samples, and the length I can control it by sub/supersampling the signal to a desired frequency. Currently I am using a frequency of 50 Hz, and I have around 1000 points for each sample.

Regarding your first issue about labels…that’s the main concern I am having in my mind. The whole dataset (without preprocessing) I am using is publicly available, and it is on the field of affective computing. The idea is to recognize individual emotional responses against stimuli, from objective signals such as the ECG. But that’s tricky because visually, I cannot label a sample just by plotting it, I just have to rely on the label that the individual in the experiment selected. It is more that I am finding hidden relations between the samples and the classes…

I’ll keep you posted here, specially if I solve some problems I am having, so that people can learn from this experience.

Best!

1 Like

Hi all,

Since today, I am starting to work partially in another project involving time series regression.

The first thing I have realized is that the time series are irregular (non-equidistant time steps), with different length, and with missing values.

This is far from the situation in the UCR dataset, which, by the way, in my opinion do not represent the real world challenges involving time series data.

Are you aware of what is the state of the art/related literature related to time series classification/regression in this situations? some papers/repos that I should check?

thank you so much!

2 Likes

I haven’t worked much with irregular time series, so won’t be able to help too much.
But you might start with a tabular model like Rossman, with your data indexed by time.
It’s difficult to help more without understanding more about your dataset (is this univariate of multivariate?, if multivariate are all gathered at the same time?, are TS really irregular or are there missing data=, etc).

1 Like

Hi Ethan, I was wondering if you were able to get your football model working in a way you were happy with. I’m working on a similar task for NBA predictions.

Have you had any luck with NBA predictions? I’ve been working on NBA predictions as well but I didn’t know if they would really be considered a time series problem because even though players follow trends each game is different and not really connected. I’ve been trying tabular but I’m curious if you’ve had any luck with using time series?

I think anything with a time dimension can be considered a time series. Whether you can make accurate predictions is another matter :grinning: So far I’ve had the most luck with random forests with some feature engineering, but I’m very interested in deep learning models. The biggest question for me right now is how to prepare the train/test data. The most straightforward way is probably to decide on a fixed window and walking forward as many times as the length of your data allows (I’m just predicting one game at a time). However, the task here seems strikingly familiar to language models (predict the next game, given a game history vs. predict the next word, given a word history) so I wonder if we can borrow some ideas from language models.

Thank you for your help @oguiza!

I don’t think I can use a model like Rossman because, as far as I know, the fastai tabular approach consists of calling the function add_datepart to extract features from the Date column. However, the index of my dataset is not a Date, but just a float number indicating the number of days before the occurrence of an event (for example, the ordered indices for one sample could be t=-5.6, t=-3.4, t=-2.1, t=-0.6).

Each sample contains a different number of records (from 2 to 23), and each record contains multiple numerical variables, so it is a multivariate time series. Also, there is missing data in some variables of some of the records. The problem consists on predicting the value at t=0 of one of the numerical variables, so it is a time series regression problem.

Maybe I could use one tabular approach like the one in Rossman, but instead of extracting features from the date column, doing the sime with features from the stats and the shape of the time series. In R, I know the package tsfeatures that extracts tabular features like the lumpiness, the heterogenkeity and the stability of the sequence…is there anything like that in Python?

Best!