Hi,
I’ve wrote a method called show_top_losses() to enhance TextClassificationInterpretation inspired by plot_top_losses in vision.learn.
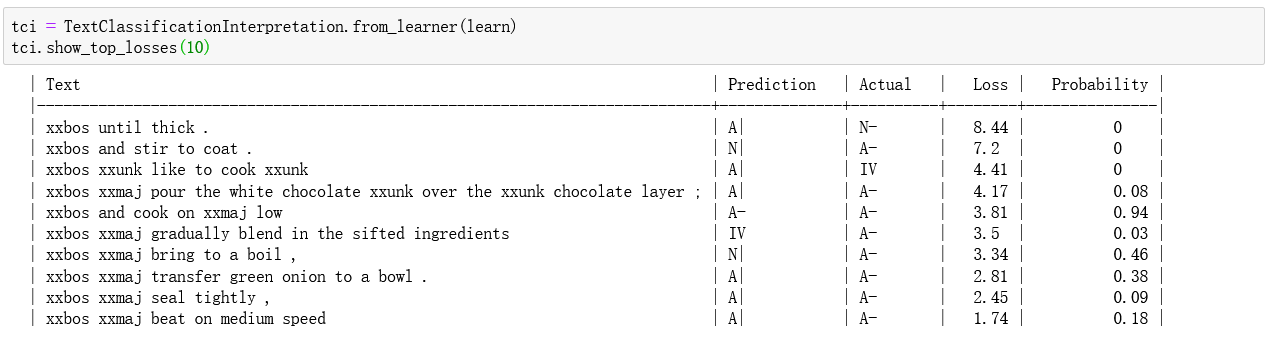
This method can creates a tabulation showing the first k texts in top_losses along with their prediction, actual, loss, and probability of actual class.
like this: (on my own dataset)
my code:
    def show_top_losses(self, k:int)->None:
        table_header = ['Text', 'Prediction', 'Actual', 'Loss', 'Probability']
        table_data = []
        tl_val,tl_idx = self.top_losses()
        for i,idx in enumerate(tl_idx):
            tx,cl = self.data.dl(self.ds_type).dataset[idx]
            cl = cl.data
            classes = self.data.classes
            tmp = (self.cut_by_line(tx.text), f'{classes[self.pred_class[idx]]}', f'{classes[cl]}', f'{self.losses[idx]:.2f}', f'{self.probs[idx][cl]:.2f}')
            table_data.append(tmp)
            k -= 1
            if k==0: break
        print(tabulate(table_data, headers=table_header, tablefmt='orgtbl'))

    def cut_by_line(self,text):
        res = ""
        width = 80
        lines = len(text) // width
        if lines == 0:
            res += text
        else:
            for i in range(lines):
                res += text[i * width:(i + 1) * width] + '\n'
            res += text[(range(lines)[-1] + 1) * width:]
        return res
I thought it is useful to me. May I add this to awd_lstm.py?@sgugger