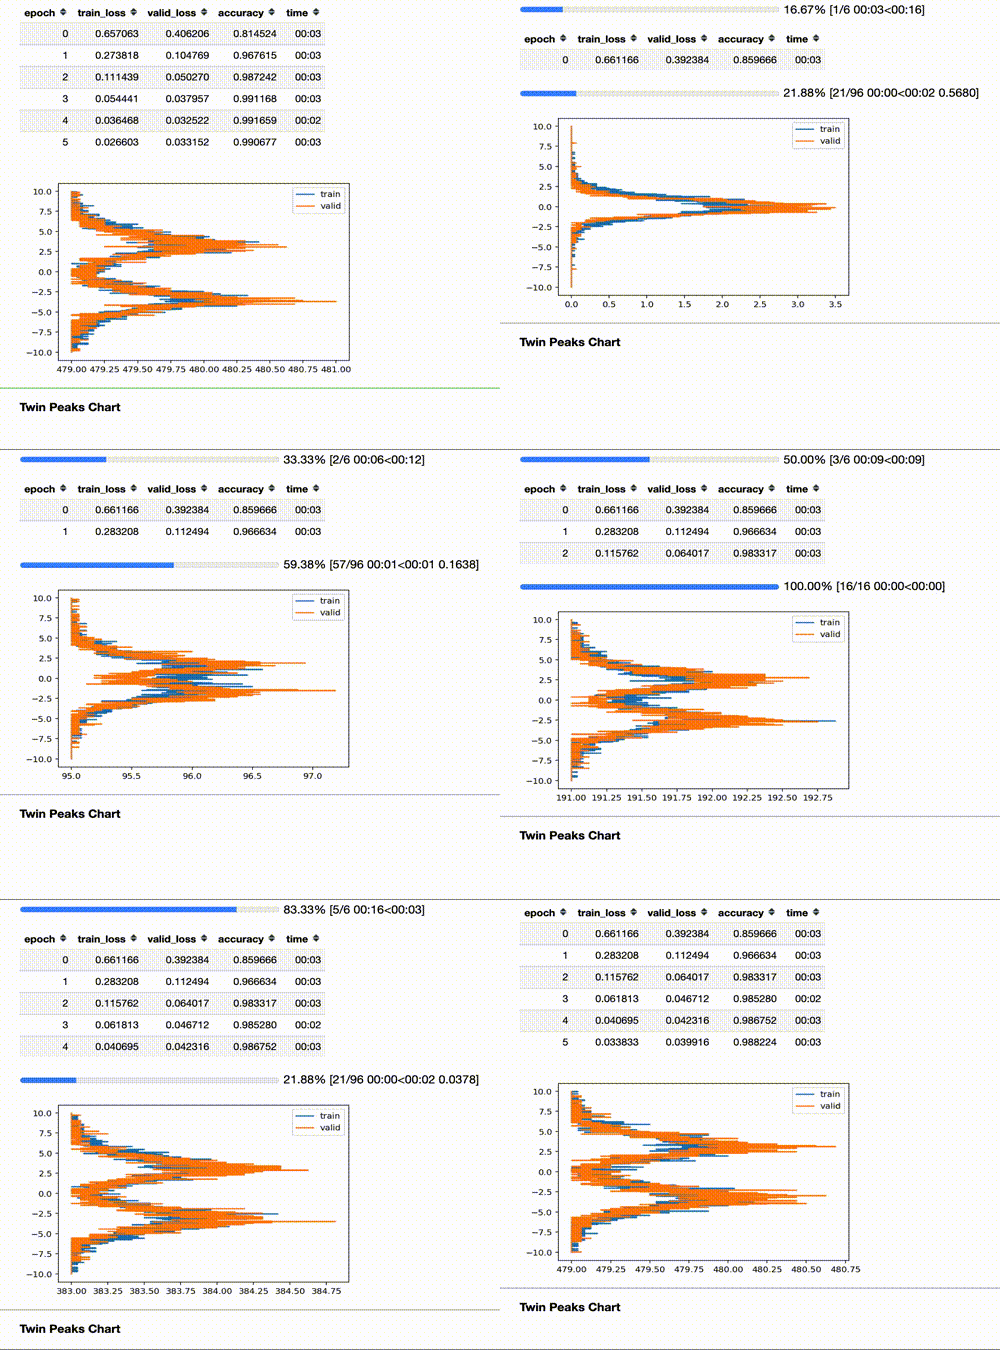
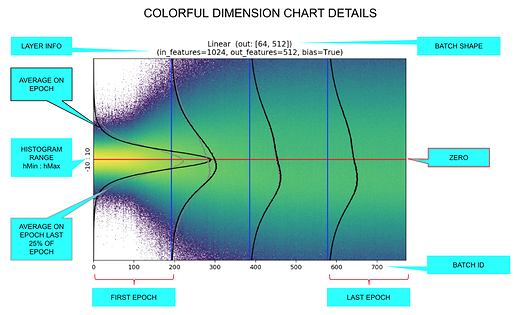
I’ve just released the first version of the Colorful Dimension and the new Twin Peaks chart.
The Twin Peaks Chart

The Colorful Dimension Chart in two lines of code
data = ImageDataBunch.from_folder(untar_data(URLs.MNIST_SAMPLE),bs=1024)
# (1) Create custom ActivationsHistogram according to your needings
actsh = partial(ActivationsHistogram,modulesId=None,hMin=-10,hMax=10,nBins=200)
# Add it to the callback_fns
learn = cnn_learner(data, models.resnet18, callback_fns=actsh, metrics=[accuracy])
# Fit: and see the Twin Peaks chart in action
learn.fit_one_cycle(4)
# (2) Customize and Plot the colorful chart!
learn.activations_histogram.plotActsHist(cols=20,figsize=(30,15),showEpochs=False)
You can find the article and the code here:
