Certainly not - it’s classifying your validation set perfectly! ![]()
2 Likes
Thank U Jeremy , it’s the reason why i asked the question  , in the sense that it was too perfect to be true .
thank’s for the confirmation.
Thanks for the help! I was able to fix it, it turns out I had an issue with the way I was normalizing / denormalizing, and the denormalized image values were not all between 0 and 1
1 Like
hope I can reach your level as well. Trying to catch up with Pytorch fundamental recently. Although it is not useful, I still think implementing the simplest model (LeNet) with PyTorch DataLoader, Dataset, training loop is a great practice. A lot of “blackbox” vanish once you print every variable shape and see how it changes step by step.
1 Like
Thank you very much for your kind messages @heye0507 and @nok! Really nice to hear that you are finding the code I share useful.
The way @heye0507 describes working through my notebooks… is very reminiscent of how I would use the lecture notebooks.
That is a super impressive progress ![]() congrats! I am guessing you might have a bit of scientific or developer background going on
congrats! I am guessing you might have a bit of scientific or developer background going on ![]() Above the speed of progress though, what counts more I think, is that the approach seems very sound. I am guessing most of the folks out there (including myself) would not be able to make progress that fast. But it does not matter - as long as one is able to tinker a bit here and there, follow the advice Jeremy gives in lectures (work through notebooks cell by cell, change a few things here and there, recreate notebooks on new datasets) I have reasons to believe all should be well
Above the speed of progress though, what counts more I think, is that the approach seems very sound. I am guessing most of the folks out there (including myself) would not be able to make progress that fast. But it does not matter - as long as one is able to tinker a bit here and there, follow the advice Jeremy gives in lectures (work through notebooks cell by cell, change a few things here and there, recreate notebooks on new datasets) I have reasons to believe all should be well ![]()
I am in the same boat as you - have been driven to understand things in the lowest of details ![]() I think this works quite okay, though I wished when doing the v2 course I would have spent more time playing with the high level API instead of jumping so quickly to trying to peek behind the curtain.
I think this works quite okay, though I wished when doing the v2 course I would have spent more time playing with the high level API instead of jumping so quickly to trying to peek behind the curtain.
On the other hand, understanding how Datasets / Dataloaders work is super useful in the flexibility they afford… and one gets a general sense of how things work. I don’t think there is a right or wrong answer as long as one still uses the high level APIs from time to time ![]()
All I really wanted to say when I started to type this message is that the way both of you describe learning is how I continue to learn ![]() Super happy to be sharing the journey with you and all the other fine people in this awesome community!
Super happy to be sharing the journey with you and all the other fine people in this awesome community! ![]()
4 Likes
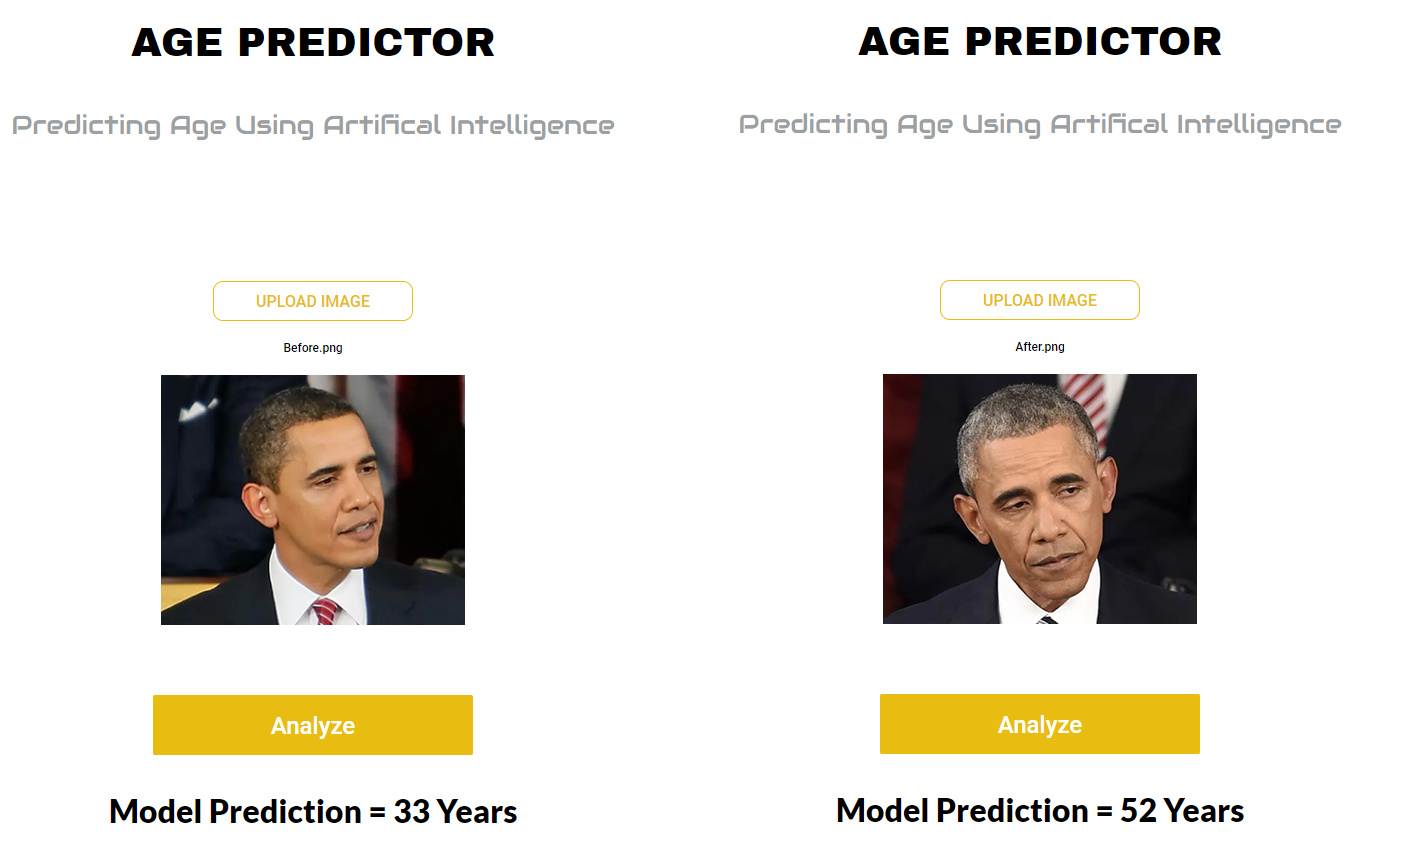
I did a picture of Barack Obama before his presidency and got 33 years, and after he got 52 years. Stressful 8 years aged him 19 years!
3 Likes
An “AI philosophy” paper I wrote that passed (pretty rigorous) peer review last fall is finally out of “on hold” status on arXiv (Computers & Society). Not sure when the journal issue will come out, but it should be soon. In the meantime, happy to share this!
1 Like
I have written another blog about altair, ipywidgets and qgrid which is useful for interactively explore and plotting data. I have quite enjoyed how you can make interactive plot with altair so far.  though it may not support all kind of plots yet.
5 Likes
i trained the ULMFIT in hebrew, and create a web that trying to predict the next word of some Political commentator.
https://segal-generator.onrender.com/
you can try translate to hebrew, predict some, and them translate back to see the result 
1 Like
Hey! I have started a little challenge of reading and summarizing a paper a day. I’ve started two days ago, and today I dived into Bag of Tricks for Image Classification with Convolutional Neural Networks which tests a number of techinques many of which are now implemented into fastai. If you are interested you can find it here. I hope you find it useful.
5 Likes
Thank you very much for the great articles!
I really enjoy them! 
1 Like
Hey @r2d2, nice work!
I noticed your notebook will work on versions <= 1.0.22 . Is there a chance of updating it to current version? Which updates must be fixed in order to do so?
Posting this here to see if there might be more eyes on it for those who might find it useful. Forgive the spam; happy to clean it up.
Find below my implementation of WideResNet from scratch modeled after Lesson 7. Trying to figure out what papers are saying and how to implement them in fast.ai is really teaching me a lot. Some takeaways:
- Darknet really is fast – really
- Though I did not test this myself, if I extrapolate from WRN’s performance in this notebook, I can see how it would perform better against fresh ResNets with a similar number of parameters; based on this and other results from the paper, I will seriously consider widening a network before deepening if I ever feel the need to increase the number of layers beyond 50
- As you can see, train_loss consistently hovers above valid_loss in later epochs, while valid_loss continues to drop; my suspicion is that the dropout layers are really helping the network generalize – bears further investigation
Enjoy!
1 Like
Check out my new articles on the implementation of Gated Recurrent Units (GRUs) using Electronic Health Records (EHR) for predicting future diagnosis codes.
Part 1: Generating artificial EHR data
Part 2: Pre-processing artificially generated EHR data
Part 3: Minimal Implementation of Edward Choi’s et. 2016 Dr. AI paper.
5 Likes
Thanks! I won’t have time in the near future to fix this, but I think you should be able to do this yourself as well I did nothing more than pass a dataset through the trained model, save the activations of the last hidden layer, and then apply PCA to those. My approach was quite hacky so I’m sure you’ll find an even better way to do it!
Hello everyone,
I want to share a project I’ve written, in which I develop a data augmentation technique.
The approach, which I call “CDA” (for Combinatorial data augmentation) is designed for classification problems in which the number of labelled images is very low, even for standard transfer learning. For example, 24 labelled images in total for a binary classification problem (it works with even less images).
In the README and jupyter notebook:
I describe the technique in detail, and test it thoroughly on the Fashion MNIST dataset, but I’ll describe it briefly here as well.
Just a note: I have not read about this approach elsewhere, so to the best of my knowledge, this is a novel approach. Please let me know if you’ve seen anything similar somewhere else.
I focus on the binary case, but the same ideas can be applied for multi-class problems.
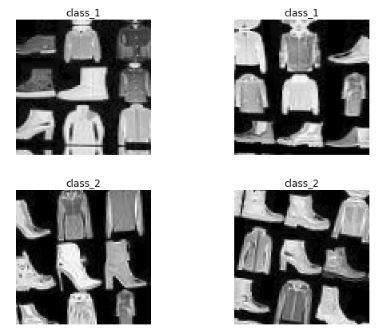
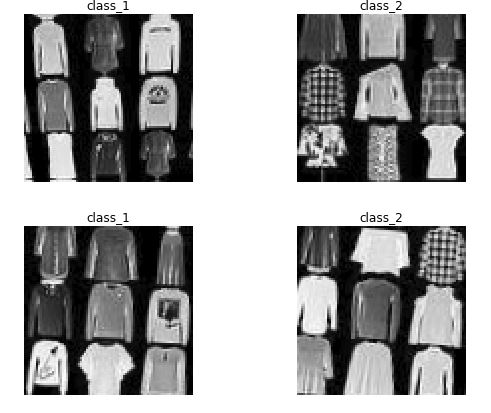
Suppose we want to classify images from these two categories (these are two classes in Fashion MNIST):
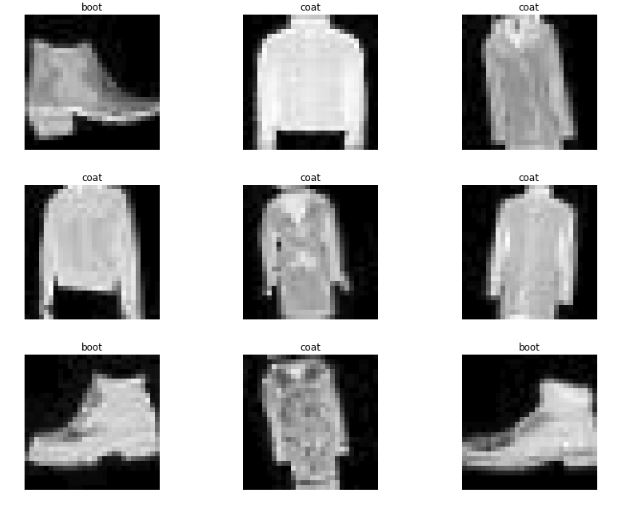
And suppose we have only 12 images from each class, so 24 labelled images in total. We could leave 8 images for validation and use the other 16 for transfer learning on resnet34, tuning the weights of the last layer. That’s going to be the benchmark, but it is unlikely to yield very accurate results on a Test set (disjoint from Train and Valid) due to the low number of examples.
What CDA does is to produce a large set of collages from the 16 images used for training. These collages are simply 3x3 arrays of images taken randomly among the 16 available for training (could be also 2x2, 4x4, etc.).
Because there are 9=3x3 locations, and 16 images available, the number of different collages is 16^9>10^{10}. We would obviously not consider all possible collages, but only a subset large enough. The label of a collage is given by the class that occurs the most among the 9 images in it. The combinatorial nature of the procedure to generate collages gives the name to the technique.
Once the desired number of collages is generated, a transfer learning from resnet34 is applied using them, and because the number of collages is now large, one can tune more than just the last layer of resnet34, which gives a neural network N_{alt}.
Finally, one applies a transfer learning on N_{alt}, based on the 16 original training images, just as it was done for the benchmark, adjusting the weights in the last layer.
The intuition is that because N_{alt} has learned to classify the collages according to the majority class in them, and this has been done for thousands of images (potentially millions), N_{alt} has learned already a lot of useful patterns related to the problem of interest. Therefore, a further transfer learning starting at N_{alt}, and based on the 16 original images, would likely do a better job at classifying the two original classes.
Experiments
Easy pair
For example, working with an easy pair: coat vs boot:
these are some of the collages obtained:
And the following shows the error rates on Test set (1000 images from each class) for both the benchmark and CDA, for different values of m=|X_t|:
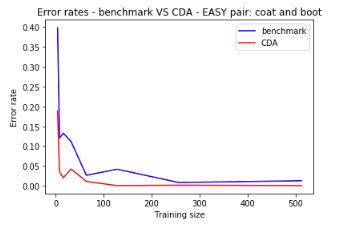
As m increases, both benchmark and CDA decrease their error rates, but CDA is always significantly lower than the benchmark. Here we have the ratio between their error rates (CDA/Benchmark):
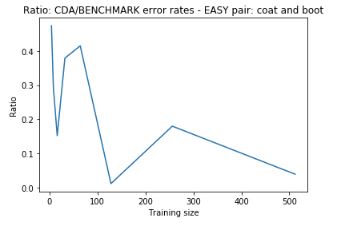
which goes from 0.5 to below 0.1.
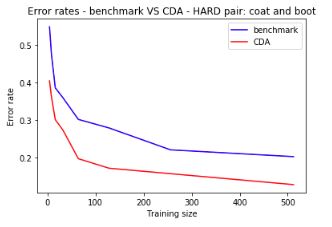
Hard pair:
Similarly, for a hard pair: pullover vs shirt:
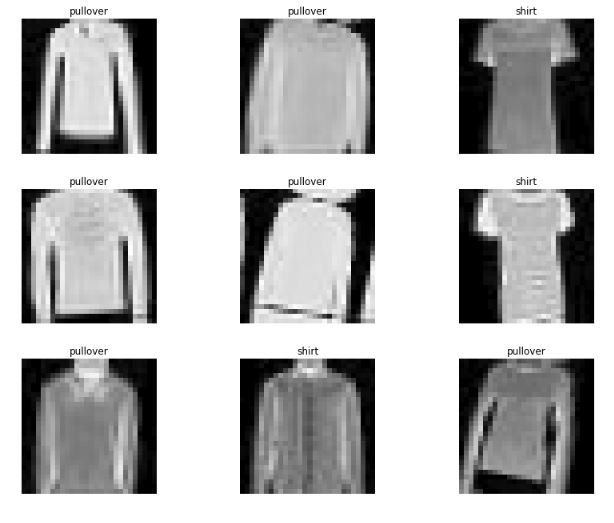
we get collages such as:
Error rates are still significantly lower for CDA:
More results in the notebook!
9 Likes
It seems really interesting.
Did you also tried using a different grid-size instead the mentioned 3x3 collage grid?
Thanks for sharing!
1 Like
Hi! thanks for the feedback @danielegaliffa !
In the notebook I used only 2x2, 3x3, 4x4 arrays. I did not try larger. They don’t have to be square either, could be rectangular e.g., 2x3. I used squared so that I only have one parameter instead of two. I tried to use grids as small as possible, so I went to 3x3 or 4x4 only when the number of labelled images was very small. As it is grows larger, like 64 let’s say, then 2x2 is enough to create enough collages.
But that’s definitely something I should explore: the impact of using larger q, for a fix number of images.
Hey people,
I wanted to share my work here.
I have written a React front end application that uses canvas to collect a drawing and make a prediction on it. The api is written in python using flask and it is deployed on render for the api and netlify for the front end.
I would happily write up a blog or tutorial on it if anyone is interested.
3 Likes