Share your work here ✅

Hi,
After lesson 4, I tried to combine tabular data with NLP, particularly in spanish.

I took a tabular dataset from an e-commerce marketplace with the objective of predicting products’ condition (new or used) based on listings’ features. It includes 100k records and after some data pre-processing (not included in the attached notebooks), I ended up with 30 features, including: 17 categorical, 12 continuous and 1 text field (listing’s title).

The process included:

  1. Creating a tabular model without the text feature (accuracy: 91.5%).
  2. Creating an NLP model to predict from the listing title:
    2.2. Training a language model in spanish from scratch: I used a Wiki corpus trimmed to around 130 million tokens (training for 6 epochs tooks 10 hours on a GTX 1080TI, reaching an accuracy of 30.5%).
    2.3. Appling ULMFiT: First training a domain language model (accuracy: 34.3%) and then classifier itself (accuracy: 81.5%). Then, the classifier was used to predict on the entire data set (probability of the product being new given the title).
  3. Creating a new tabular model, this time adding as a new feature the prediction coming from the NLP model (final accuracy: 92.4%).

I tried also extracting the last linear layer’s activations (50) from the NLP model and feeding them in the tabular model, but it didn’t improve accuracy. Something that I didn’t reach to try was removing the output layer of both models, concatenating the outputs and feed it in a linear model (unlike my simpler model, this would backprop to both models).

In this case, the effort of training the NLP model (particularly the spanish model from scratch) just improved something below 1%. However, it was nice learning exercise and now I have a spanish pre-trained model, that hopefully will be useful for others projects thanks to ULMFiT. :slight_smile:

25 Likes

That’s a relative error improvement of >10%, which is a lot! :slight_smile:

4 Likes

I’d be interested to see that, if you get it working…

7 Likes

Hi,

I have an issue I want to know how to solve with deep learning. I have a list of “office hours” of service provider for homeless people in the city, usually in human readable format like:

“hoursOperation”: “Mon, Tue, Thu, Fri 8:30 am-11:30 am”,
“hoursOperation”: “Groups are held on the First and Third Wed 9:30 am-11 am”,

etc etc in other human friendly way …

and I want to translate those into something more machine friendly like:
{
“startTime”: “17:00”,
“endTime”: “18:00”,
“dayOfWeek”: [“Tue”, “Wed”],
},

what is the proper approach for this? I don’t think is classification. Would this be translation?

Thanks!
//

Hi all.

I finally wrote up my blog post about creating the guitar classification model. In the previous days I decided to redo the exercise and incorporate the new data block API, progressive resizing and other goodies of fastai v1.
Please let me know if my description of the one-cycle-routine, progressive resizing, etc. is off.

I think the results came our real nice and I’m still amazed how good progressive resizing works!

Notebook and other links are included…

Next on the list are write-ups:

Will be a little mini series in the end :wink:

22 Likes

Upgraded UCR Time Series Classification to image notebook

I’d like to share with you changes I’ve made to the OliveOil notebook I originally created based on some of the feedback received.

I’ve made the following updates gist:

  • Modified data source so that any of the 85 univariate UCD data sets can be used now
  • Added 3 new time series encoders
  • Modified the time series to image encoders so that images of different sizes can be created, independently of the time series length
  • Up to 3 encoder can be simultaneously used. Each encoder creates a single channel image, and a 3 channel image is created by combining them.
  • Incorporated the new data_block functionality

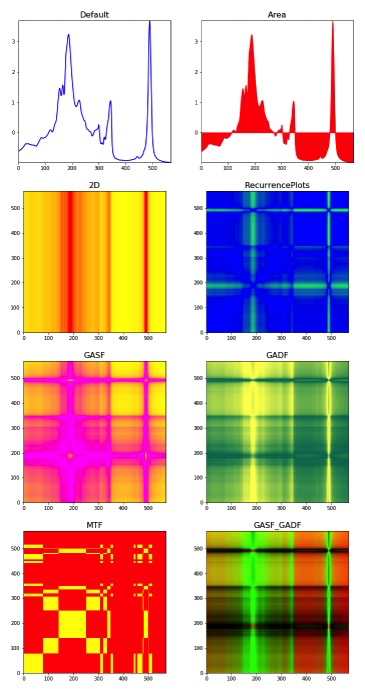
There are 7 image encoders available:

  • ’Default’: raw time series
  • ’Area’: time series area plot
  • ’2D’: time series in 2D
  • RecurrencePlots: Recurrence Plot
  • GASF: Gramian Angular Summation Field
  • GADF: Gramian Angular Difference Field
  • MTF: Markov Transition Field

This is how the same time series would look like after an encoder is applied:

I’ve run many tests with this updated notebook. If you are interested, you can read the key learnings in the Time series/sequential data study group thread.

13 Likes

Hello Everyone!
We (@kranthigv) had planned to write a blog since a longtime and finally we did it.
Check it out!

10 Likes

I tried to implement the embedding approach in the Collaborative Filtering from scratch in Keras. I got terrible results on the movielens 100k dataset :disappointed:
This is the accuracy of the model:
model_accuracy
This is the losses of the model:
model_loss

This is the Keras model:

num_factors = 5 # embedding dimentionality

# input
users_input = Input(shape=(1,))
items_input = Input(shape=(1,))

# embedding
user_weight = Embedding(num_users, num_factors, input_length=1)(users_input)
item_weight = Embedding(num_items, num_factors, input_length=1)(items_input)

# bias
user_bias = Embedding(num_users, 1, input_length=1)(users_input)
item_bias = Embedding(num_items, 1, input_length=1)(items_input)

# the collaborative filtering logic
res1 = Dot(axes=-1)([user_weight, item_weight]) # multiply users weights by items weights
res2 = Add()([res1, user_bias])                 # add user bias
res3 = Add()([res2, item_bias])                 # add item bias
res4 = Flatten()(res3)
res5 = Activation('sigmoid')(res4)              # apply sigmoid to get probabilities
# scale the probabilities to make them ratings
ratings_output = Lambda(lambda x: x * (max_score - min_score) + min_score)(res5)

model = Model(inputs=[users_input, items_input], outputs=[ratings_output])

I need to figure out what I missed to improve the model. All is detailed in this blog post. Any improvement suggestions?

Continuing our series of updates to our aircraft classifier project, I have added the Data Block API and progressively resized the dataset, from 32x32, to 64x64, to finally 128x128. We are now at 99.3% accuracy. Hooray.

Using the new model I have created this web app. Check it out at: deepair-v2.

I’ve written the following short Medium post describing the details of the process.

The accompanying notebook can be found at this gist.

3 Likes

Hi, everyone.

I have been playing around with audio classification, using bachir’s strategy of transforming the audio signal into an image represents its spectrogram, and then performing transfer learning on those images using the guidelines from the first three lessons. I tried this with the dataset from the tensorflow speech recognition challenge from Kaggle last year (https://www.kaggle.com/c/tensorflow-speech-recognition-challenge/) and I got an interesting result. The dataset comprises short utterances containing commands such as up, down, stop, go etc. In my first trial, I excluded the categories unknown and silence to facilitate training.

The best result was superior to the first place in the private leaderboard of Kaggle 10 months ago. However, I’d need to include the unknown and silence categories to perform a fair comparison.

I also applied this same approach to emotion recognition from speech using the IEMOCAP database (https://sail.usc.edu/iemocap/). This database contains speech signals uttered by actors and labeled in categories such as sadness, happiness, anger and so on. I started with two classes with a decent amount of data (one thousand samples each) and the first results are encouraging: I got about 93 % accuracy differentiating between anger and sadness. I’m curious to see the performance for the entire dataset.

Cheers

4 Likes

I am working on an object verification problem that need to add new categories regularly. (similar to face verification, we first show the identity card and a model will verify if the face is matching)

I found 2 approach from here how-to-add-a-new-category-to-a-deep-learning-model . It says that we can retrain the model with old weight and adding this new category or using Content-based image retrieval. It means that we base on the last layer feature vector to decide the category (by calculating their hamming distance and euclidean distance). The paper of this technique you can find it here: Deep Learning of Binary Hash Codes for Fast Image Retrieval

Below is the image of concept of this technique:

I have tested the technique with Mnist data set, from number 0 to number 7 only. Number 8 and 9 will be add later. I use only the binarizing code of the last layer in this moment. I tested with number 9 and the results is quite ok. Every other numbers have low similarity (<60%), except number 7, it has 90% similarity with number 9. I will continue to test with Euclidean distance rather than this binary hamming distance.

1
7
I have written a blog about this here: Object Verification with Deep Learning of Binary Hash Codes
Source code is quite messy but if you are interested, you can find it here

I am very appreciated if someone can suggest me some techniques to deal with this problem. Thank you in advance

9 Likes

All - I took a stab at the Amazon Bin Challenge i.e. count number of items in Amazon Pods: https://registry.opendata.aws/amazon-bin-imagery/

Here is the github: https://github.com/btahir/Amazon-Bin-Challenge

I have a python script in the repo that will download a subset of the data for you in case you want to try this challenge.

Here are initial results:

14%20PM

8 Likes

Hi Matthew,

That is the “data wrangling” part - prepping raw data into a format more useful for analysis or ML models. How you slice and dice depends on what you are trying to do, and the design of your model. It looks like you may want to construct tabular data and perhaps look at relationships of other dimensions based on day of the week and/or time.

If that’s the case, you might be interested in the concept of “embeddings for categorical variables”. Here is a useful blog post and workshop video from Rachel on the subject:


https://www.fast.ai/2018/04/29/categorical-embeddings/
4 Likes

wow, thanks! Will take a look and ask more questions!

I don’t think our normal convnets will work well for that. You’ll need to use object detection, which we should be covering in lesson 6.

8 Likes

Ah ok thanks thats good to know!

Regarding music spectograms, can’t we do something like this to perform data augmentation

  • We can split the thirty seconds(let’s say 30 sec audio files) into 10 chunks, 3 seconds each… Each window of the song will be tagged with the same genre of the original thirty seconds.
  • If a song had rock as genre, then all 10 windows that came out of the splitting will have rock as genre. This trick gives 10x more data than the original dataset.
3 Likes

That sounds like a good plan. I haven’t tried it myself, but I’ve read some papers proposing that with success.

1 Like

A little late to the game but here is my experiment with creating and deploying a cuisine-type classifier (5 cuisines, with ~200 images each in train+valid).

Learnings:

  • Surprisingly only resnet50 was able to bring the accuracy to >70%. Struggled with resnet32 to get accuracy beyond 60% (tried changing lr, batchsize, image_size, data augmentations, ran more epochs until I saw some small sign of over-fitting)
  • Increasing image size from 224 to 299 and using flip_vert=True in data aug and using resnet50, was able to bring the accuracy to 70%

Notebook: https://nbviewer.jupyter.org/gist/oostopitre/e5d0c075d5c5e116f890e47d7fb4ec0b
Web-app: https://cuisine.now.sh/

Next Steps:

  • add other popular cuisines (french, italian, etc) and a ‘other’ category for non-food images and check the model performance
  • web app: add some default sample images that the user can select and test, ability to pass a URL, add GradCAM activation maps, add class prob as a graph

Pro-tip:
If you haven’t already check out imgcat and imgls. Makes working with image files on a remote machine from a TERMINAL so much easier. See https://github.com/olivere/iterm2-imagetools

2 Likes

What do you mean by object verification? Are you saying you can have say 5 pre-trained categories A, B, C, D, E and given a new object you want to be able to classify it as A, B, C, D, E or neither? The method you are citing is an instance-based method and is used to find similar objects by comparing distances between a set of feature vectors extracted from the image. I am working on an image-similarity problem so maybe we have the same use case.