Share your work here ✅

I wonder if specific frequency isolation would help? Throwing away the right hand side of the spectrograms doesn’t look to lose much visually.

I just finished combining @r2d2’s PCA-based feature interpretation of resnet50 trained on @hkristen’s imageCLEF (full) Plant Identification Challenge dataset. Here’s the notebook: https://nbviewer.jupyter.org/github/poppingtonic/deep-learning-experiments/blob/master/imageCLEF2013_plant_types.ipynb

3 Likes

That’s overfitting

No it’s not. Accuracy is always shown on validation set. See my earlier reply.

3 Likes

Hey everyone,

For my project I wanted to check if the resnet model can generalize to the style of an artist. So I downloaded artworks of Van Gogh and Monet and using resnet 50 in under 10 epochs trained it to 94% accuracy.

I thought that because all the images are different, it would be harder for the network to pick the style (i.e. generalize), but it turns out this is not true at all.

30 Likes

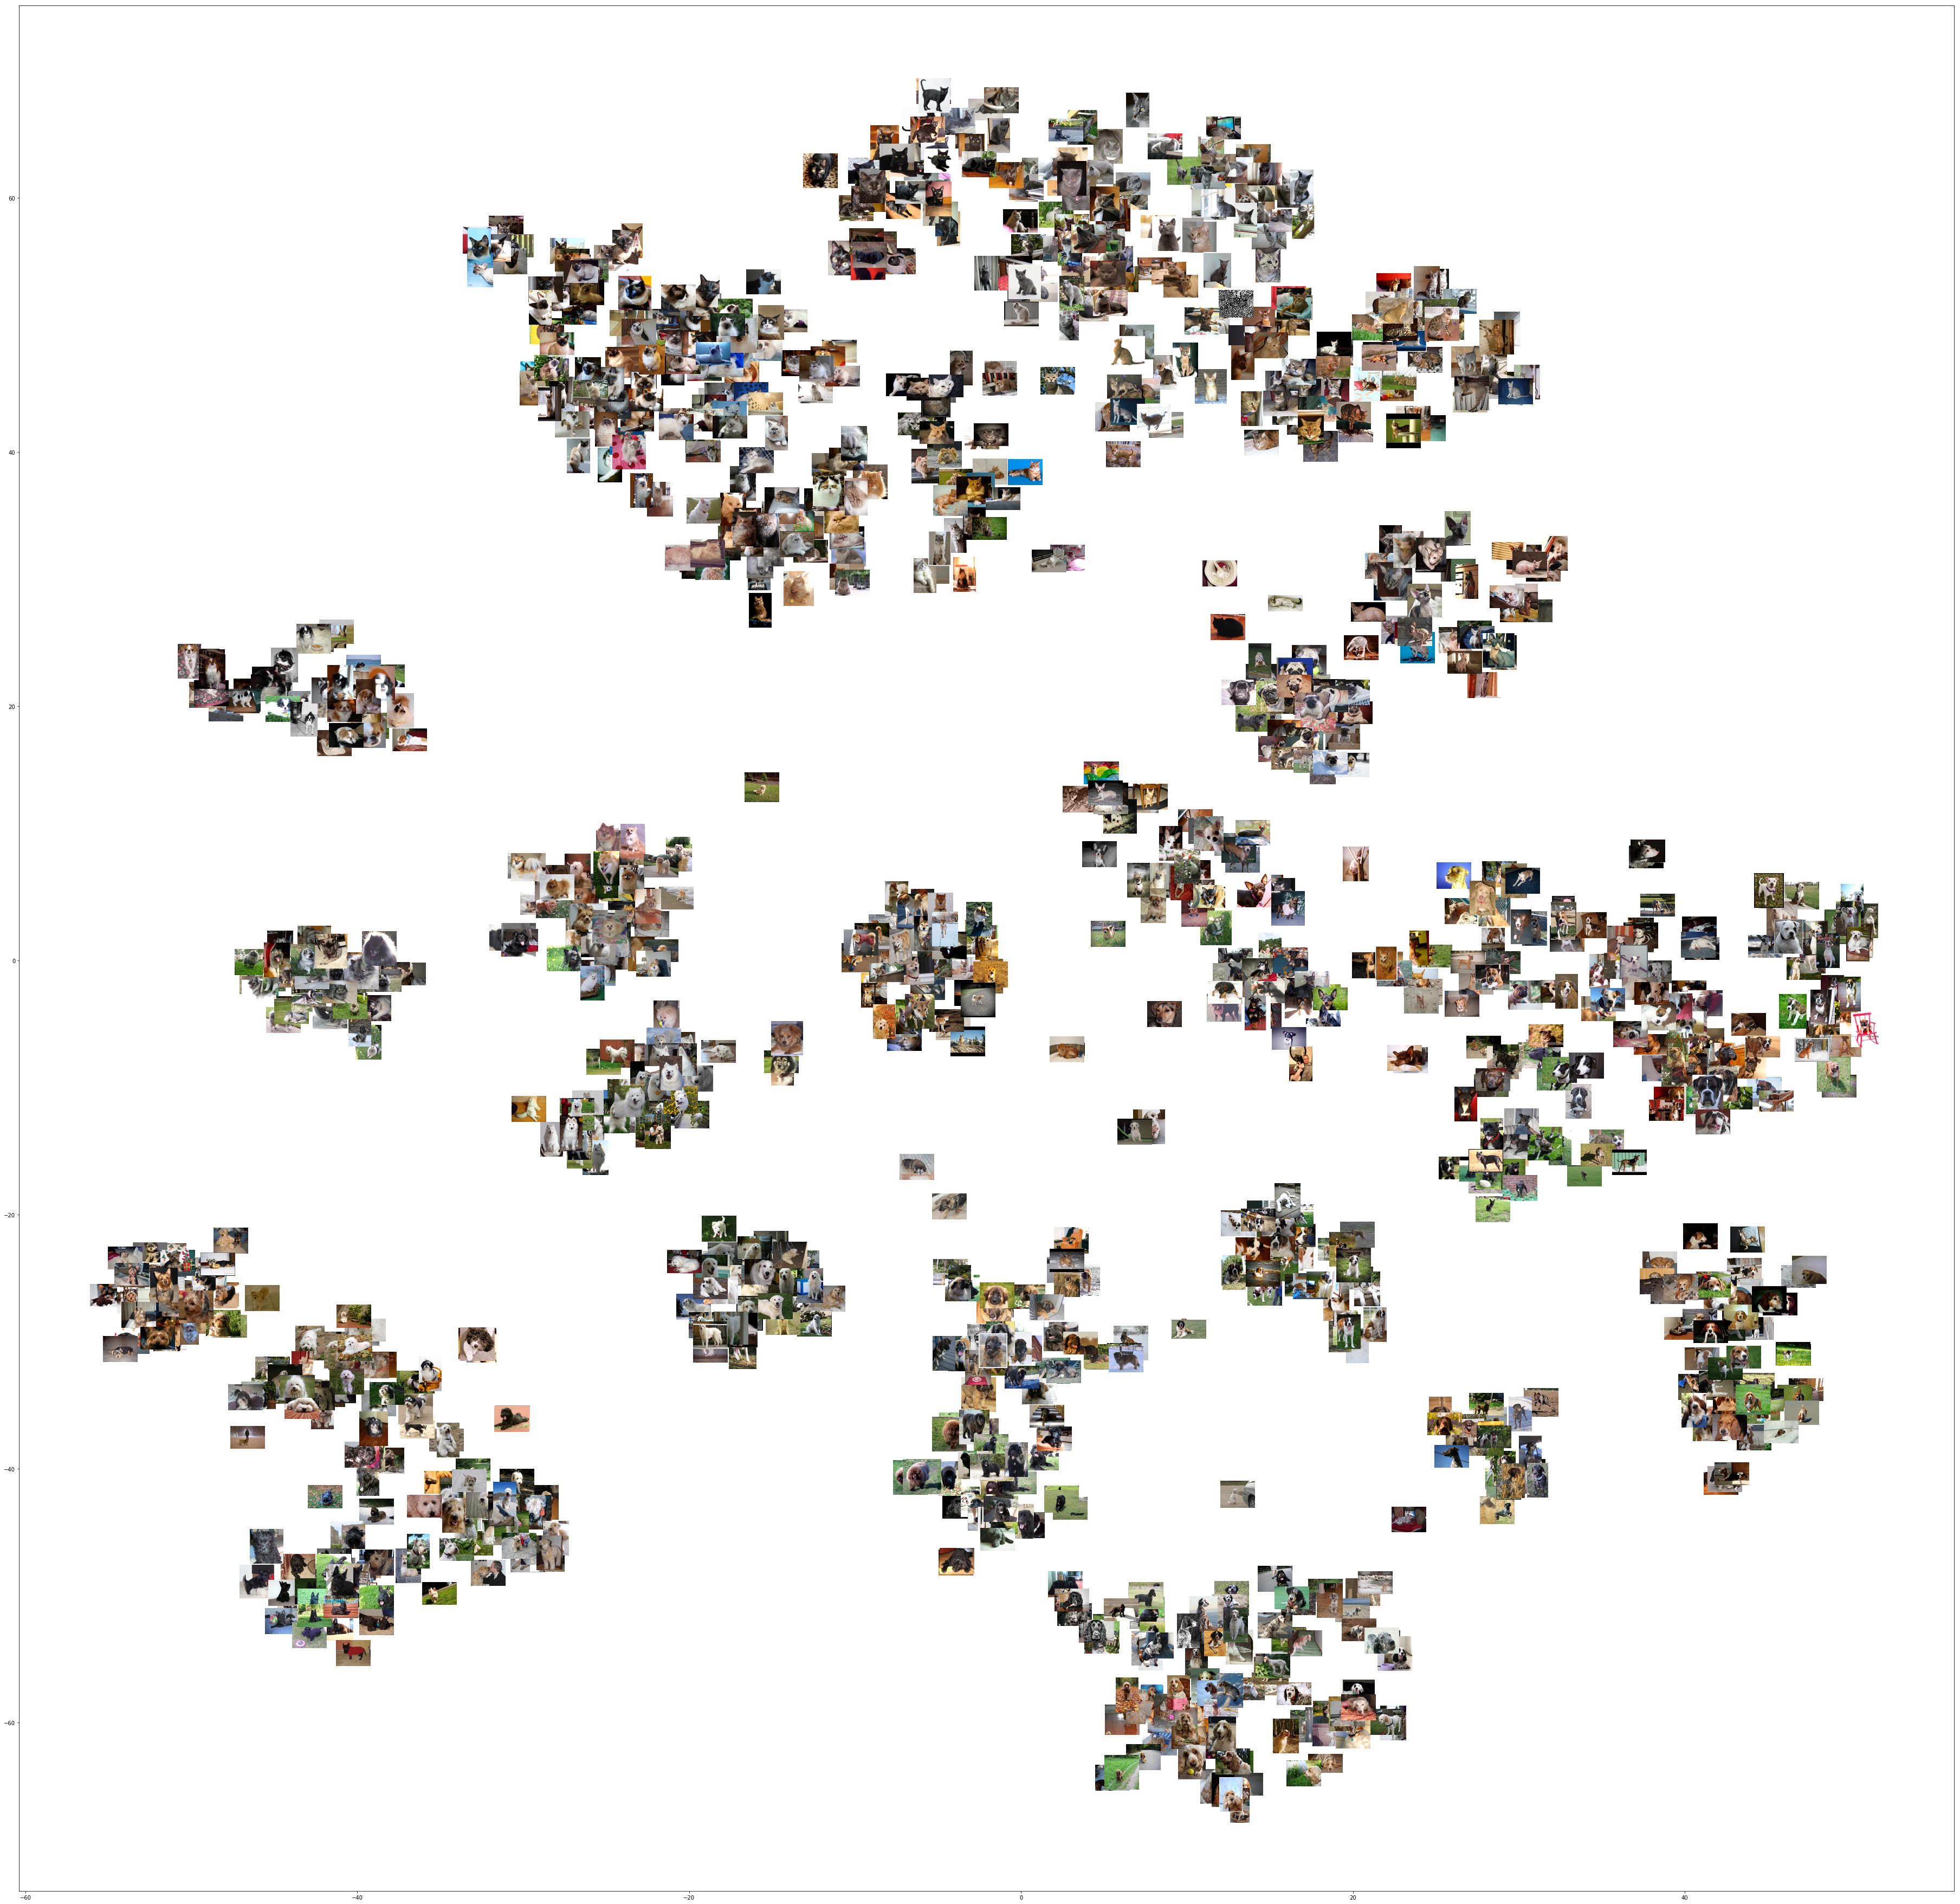
I grabbed activations from inside the model and ran them through a t-SNE to see how different dog/cat classes would cluster.

This is from the final conv block:

Also looking at how different activation layers in a conv block extract different features.

From a ReLU layer:

51 Likes

Very interesting work!
I have a query, the plots indicate for a particular class (the weights plot of the model)… that’s fine but why are they having lot of common things also in them?
Like few are detecting edges, contours and then the dog as a whole, even the background as if there’s an emboss of dog in the surrounding and few are black or
hard to see what theyare doing actually?(the black ones)

Intriguing ! How about trying normalizing with a subset of your train data than with imagenet stats?
You should also definitely augment.
Let me know if you’ve tried :slight_smile:
Also, +1 on fine tuning max 1-fold first.
FYI the link shared:https://.weebly.com/urbansound8k.html is broken

Here’s the link to the ds: https://urbansounddataset.weebly.com/urbansound8k.html

Hi relly fun project

  1. Looks like you are training one fold at a time instead of all in one go. Is there a good reason for reducing the size og the training data like this ?

  2. I would take af look at the default setting in http://docs.fast.ai/vision.transform.html#get_transforms and disable rotation . i cannot se how you data could benefit from rotation

  3. let your training run longer say a cycle of 10

  4. possibly have a look at the max_lr and wd argument in fit_one_cyle

by the way you visualisation could really benefit from colorcets linear colorscales. hard to be a good linear grayscale

@etown we are working on a similar lines i.e. basically representing audio thru image and doing classification. really good to have someone thinking on similar lines…we are working on data from this kaggle competition. Will share the results shortly. if u have any more learning pls do let us know :slight_smile:

4 Likes

Can human recognize all full MNIST data set images or is there some strange numbers? Like why no one have ever got 100% accuracy when our models can predict nearly perfectly something much more complicated.

Yes some of the labels are wrong or ambiguous.

2 Likes

Downloaded the Urban Sounds database a while ago (trainingset with 5425 sounds in 10 classes (drilling, jackhammer, dog barking etc.) Converted de soundfiles (wav) into spectrograms (pictures repsesenting the sound) using the librosa package (Python).

Got a 96% accuracy! on the first attempt using the code in lesson 1.

More to come!

61 Likes

Well done. Could you share your notebook? (If it’s not already in a github repo, you can use the ‘gist it’ extension to share.)

7 Likes

My image dataset now has 9 field sports - and I am into the low 90’s with resnet50 and a little fine tuning (as per lesson 1). The confusions makes sense - not sure why some are pretty symmetric (Aussie rules and rugby) and others not (cricket v baseball). To improve the accuracy I’m thinking more data and some image curation. Any other ideas? Differentiating what people are doing is certainly harder than pure identity.
[(‘cricket’, ‘baseball’, 8),
(‘aussie’, ‘rugby’, 7),
(‘rugby’, ‘aussie’, 5),
(‘rugby’, ‘soccer’, 5),
(‘soccer’, ‘rugby’, 5),
(‘athletics’, ‘fieldhockey’, 4),
(‘aussie’, ‘soccer’, 4),
(‘cricket’, ‘aussie’, 3),
(‘lacrosse’, ‘fieldhockey’, 3),
(‘soccer’, ‘cricket’, 3),
(‘athletics’, ‘aussie’, 2),
(‘aussie’, ‘baseball’, 2),
(‘fieldhockey’, ‘soccer’, 2),
(‘football’, ‘cricket’, 2),
(‘football’, ‘lacrosse’, 2),
(‘football’, ‘rugby’, 2),
(‘football’, ‘soccer’, 2),
(‘lacrosse’, ‘athletics’, 2),
(‘lacrosse’, ‘football’, 2),
(‘rugby’, ‘fieldhockey’, 2)]

2 Likes

Convolutional kernels are good at detecting edges. You can play around with the concept here

http://setosa.io/ev/image-kernels/

The dog images in my post come from activations after a ReLU function defined by x = max(0, x). I imagine the entirely black squares were all negative numbers in the previous layer that got zeroed out by the ReLU.

4 Likes

@MagnIeeT and me are working on the audio dataset from kaggle competition and converted them into images using Fourier transform(FFT).
We performed multiple first cut experiments taking top 3, 7 more frequent classes.
We are getting ~84% accuracy on 3 classes.
image
Few images of top losses(each graph is FFT of audio clip)

image

The performance degrades with increasing number of classes
image
Next steps will be to change how we are doing fourier transform on audio images (the sampling frequency of audio file. Window size we selected was 2 seconds, need to adjust corresponding to notes frequency). Need to test this approach on bigger datasets as our data is currently very small. Also we are planning to use spectrogram as tried by other users.

Google audio dataset is another good source providing 10 sec audio snippets. We initially planned to use but parked it for later as it is more suitable multi label classification

13 Likes

neat. would love to be able to go through the notebook.

1 Like

@raghavab1992 It’s really interesting work you are doing. Could you please write a blog post about it and I guess if we get to see the notebook it will be really great resource to learn from.

1 Like

Cool!

Did you use the 10 fold CV As described in the dataset notes? If not, your accuracy is misleading. Take a look at the dataset website. I had similar results, but it’s much more difficult doing the CV and if you don’t you can’t compare it to accuracy in the literature.

Would love to see your nb :slight_smile: