Share your work here ✅

Yes, me too. I’m not sure why the accuracy is so high but I suspect it’s because programming has lots of highly repeated things.

For example, if you’re in a code block and you see an open paren, there’s probably a close paren coming. And if you’re writing JS and see “var x” the next token is likely “=“.

This is an area I’d like to explore more. I’d love to get a dump of all public GitHub gists and see how well a language model could learn to generate code.

Cool! I just came up with the same idea, thinking of that it may become a new way for a computer to learn anything by itself.

Hello :wave:t3:,

As I advance through the course, I’ve worked on my first NLP project. The objective was to measure the tonality/sentiment of a tweet. I started with the language model trained on WikiText-103, fine-tuned it using a sample of tweets from the Sentiment140 dataset.
From there, I was able to create my tweet classifier which remains basic, as it has difficulty detecting sarcasm.

4 Likes

Hey, I used your model on my dog (black goldendoodle) and got a really surprising result if I’m interpreting it correctly.

It was toy_poodle (9.34%), bouvier_des_flandres (8.27%), standard_poodle(5.75%). I’m assuming his breed isn’t in the list, but it really surprised me to see the top class have less than 10% probability. It must be really confused haha. Thanks for sharing

Pic in question. Actual breed: goldendoodle (AFAIK)

Hi everyone,

It’s my first time posting in this forum, and I want to say really thank you to fast.ai and Jeremy and everyone in the community.

I came across fast.ai only last summer with almost no coding or AI experience whatsoever and really learned a LOT from the community. (To be honest, I was too reluctant and timid to post on the forums up to this point … one of my biggest regrets) Through fast.ai I was able to learn

  1. Coding basics and I mean everything!!! Through going through forums and posts from the awesome community, I was able to learn from bash to deploying containers with docker, (AWS, bash, ubuntu, tmux, vim, python frameworks such as Django and Flask, just to name a few!) fast.ai not only gave me the opportunity to practically learn artificial intelligence even as a novice, it really opened a whole new world of computing, programming, and data science to me and I am extremely grateful - cannot thank you guys enough.

  2. Practical deep learning (as the name suggests) from a top-down approach (as Jeremy has often referred to). To be honest, I’ve tried Data Science and AI courses in Udemy before joining fast.ai when I was a complete beginner but was not able to get a good feel and grasp on it … Often it was too complicated and intimidating and was rather impractical that can be only applied to certain use cases. Also, it was hard to get help from others since it was a closed community. (Plus, it cost several dozen dollars!!)

  3. Life lessons and philosophies. For example, the “top-down approach” notion that Jeremy mentioned in his class really struck and literally was a complete paradigm shift for me. Until then, I was going through fundamental python online classes but literally had no idea on where to apply and utilize it. However, through the “top-down” approach I was able to have a complete clear notion on where, what, and why to apply this knowledge; becoming able to learn remarkably faster - through derivatively looking up things I didn’t know on the forum, documentation, googling. Literally a game-changer in the dynamics of my life!!!

Again, thank you to fast.ai and Jeremy and everyone in the community. fast.ai has without a doubt, opened up whole new possibilities for me and forever has changed the course of my life.

4 Likes

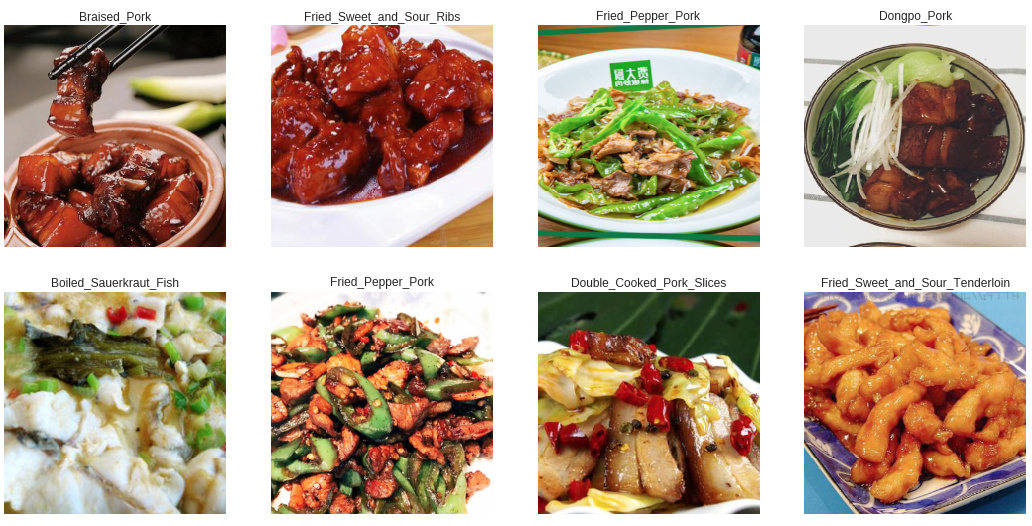
I am a Chinese foodie who eat and cook a lot! So I’ve built a super ‘delicious’ model to identify some very similar Chinese food. And by ‘delicious’, I mean it really made me hungry when I looking over the datasets.:joy: Check this out!

Chinese Food Classifier

I finally got a 79% accuracy which was not very outperforming but was beyond my expectation, because sometimes I can’t even tell the differences between them. However, I printed out the images that the model got the wrong answers on and I noticed some were noisy data that I haven’t cleaned out, also some were actually recognizable by human. So there still a large space for improvement.

To see how the model was doing on differentiating some similar food, I modified the original function most_confused() in fastai library and create a new function called most_confused_mutual() to return the model’s confusion between any of two classes. For example, one of the results were presented as: ('Braised_Pork', 'Dongpo_Pork', 4, 5, 9) which means the model incorrectly recognized Braised Pork as Dongpo Pork for 4 times and 5 times for the opposite case, and 9 times in total. This method can show us how similar some pairs of classes are, and help us to figure out whether it is a model problem or just the datasets are too difficult even for human.

I also proposed this as a new feature for fastai in a thread: most_confused_mutual().

Hope you enjoy Chinese food!

2 Likes
3 Likes

Hi everyone,
This is my first post here to this thread. I did the 2018 course but without as much of my “own” work as I wanted to do. Doing the 2019 course, much more intensively. I have worked for a long time in financial markets and am very interested in economic history and bubbles. Thus, I am very into things like how gold has been used as a store of value for thousands of years. I’ve also followed the evolution of cryptocurrencies, especially the debate about whether they can be true stores of value, independent of fiat currencies. Anyway, for my first project, I decided to do an image classifier, to classify between gold, silver, and copper coins. I got about 97% accuracy which I was thrilled with. I created a webapp on Render, which I have to say was a lot easier than I thought it would be. I’ll post the code at a later date, but here is the webapp.
https://classify-gold-silver-copper-coins.onrender.com/
I’m excited to write a longer post on Medium. Thanks to the entire fast.ai team for their life-changing work.

1 Like

Wow, these are amazing results! How big is your dataset and what type of spectrogram do you use (i.e. sampling rate, window type, size, overlap, etc).?

My task is a bit different, I am identifying whether or not the file has a manatee call in it, and my results are not anywhere near what you’ve got!

1 Like

I’m going over part 1 of the course, and for week 1 homework, I got ~79% accuracy doing classification on a subset of sounds from the BBC sound effect archive. I thought that figure was pretty ordinary until I just started week 2 when Jeremy points out the other student that got 80% which represents a new SoA! Also, I was trying to discern between sounds categorised as “Aircraft”, “Boat”, “Car” and “Train”, so 79% is certainly a lot better than I would do by ear… and the spectrographs certainly look the same to me!

It’s just a toy project for now, but it was fun! Here’s the notebook, here’s a medium post covering the overall project, and here’s another medium post with painful detail about the data acquisition & preparation.

No fancy tricks I’m afraid, most of my effort was in the data prep, otherwise I basically followed the week 1 notebook :slight_smile:

Would love any feedback!

2 Likes

After Lesson 7, I tried my hand at building a super resolution model that restores movie poster images (by improving image quality and removing defects). I trained it on a dataset of ~15,000 movie poster images, which I was able to find for free online.

Technical details:

  • The first step was to get some images of movie posters. I found a website which had a large database of images. They had an API which was quite easy to use, and it wasn’t too hard to build some code to automatically download 15,000 images
  • Next, I needed to create my lower-quality images. I created a “crappificate” function (inspired by Jeremy’s crappify function), that reduces image size, reduces image quality, and draws a random number of circles of random size and color on the image. The circles can be red, yellow, or brown. The idea is that it simulates someone spilling ketchup, mustard, or BBQ sauce on a movie poster
  • Creating the model after that was not too hard, as I was able to use a lot of Jeremy’s code from the lesson. There are a few parts of it I don’t understand yet (e.g. the gram matrix loss function, why we set pct_start to 0.9 when training, and the [5,15,2] layer weights values we pass into the loss function), but it sounds like we might cover this in Part 2
  • One other interesting thing was that I used rectangular images, rather than square images (I trained with sizes of 192x128 and 384x256). It seemed to work, but I remember Jeremy saying in an earlier lesson that using rectangles properly requires a fair bit of nuance, so I’m hoping we cover this in Part 2 as well
  • Code for the model is available at GitHub
5 Likes

From the pictures it looks like you are using data augmentation for “normal” pictures.

I am not sure if this is of help for frequency spectrogram data as you make it harder for the network to associate a region with a specific frequency.
Did you tried it without the data augmentations that “mess up” this location frequency link, i.e., no rotation or flip?

I would expect that this should work better, but I never worked with similar data.

Maybe you find also interesting approaches in this thread by searching for them, as I remember other posts about spectrogram data.

1 Like

Actually, thinking about this a step further after reading the docs. I’m not sure it will help. In theory, a car noise played (seen) backwards is still going to sound (look) different to a plane noise backwards. It’s more about adding some extra pixel values to the dataset to encourage better generalisation. But that said, none of the images in the validation set - or real life - will ever be transformed; it’s not like a photo where you’re going to get a slightly different angle of a bear. The input data is always going to be a certain orientation.

I don’t know. I’ll try, and see. :slight_smile:

Update - Thanks @MicPie, that suggestion did improve things! I changed the ImageDataBunch parameters to include
ds_tfms=get_transforms(do_flip=False, max_rotate=0.), resize_method=ResizeMethod.SQUISH. Training on resnet50 with 8 epochs and a chosen learning rate resulted in a final error rate of 0.169173, better than the previous ~0.21. So that’s around 83% accuracy, even better than the other SoA sound classification result from @astronomy88.

I’d love to know why this made a difference. Hopefully it will come up in the remaining weeks. Now I’ve watched week 2 - time to serve this model up in a web app…

2 Likes

Hi,
I am having trouble creating my .pkl file for my model. Here is the code -my .pth file is in /content/drive/My Drive/bus_5routes/models/

import pickle

filename = “saved_model_fastai”
outfile = open(filename,‘wb’)
pickle.dump("/content/drive/My Drive/bus_5routes/models/final.pth",outfile)
outfile.close()

infile = open(filename,‘rb’)
model_from_fastai= pickle.load(infile)

learn.load(‘model_from_fastai’)
gives the error -
FileNotFoundError: [Errno 2] No such file or directory: ‘/content/drive/My Drive/bus_5routes/models/model_from_fastai.pth’
losses = model_from_fastai.predict(img)
prediction = losses[0];
prediction


AttributeError Traceback (most recent call last)

<ipython-input-6-66a3f3b93af5> in <module>() ----> 1 losses = model_from_fastai.predict(img) 2 prediction = losses[0]; 3 prediction

AttributeError: ‘str’ object has no attribute ‘predict’

Thanks.

Intresting !!
:sweat_smile::pray: , Glad U liked It , i’ll Soon share the Function That I used , it might be usefull to U as well.
https://colab.research.google.com/drive/1zINYrLPEq1yhawVgmLTS6l2yWNlFfgv0

& here’s from where i got it :

https://stackoverflow.com/questions/44787437/how-to-convert-a-wav-file-to-a-spectrogram-in-python3 (why bother making it from scratch right :smile:)

As to the Data set , it was about 12 Spectograms per whale , so it was as u can see not that big , the reason for that , is , on the internet , u do not get whales sounds of about 3 minutes long or something like that , and even if u do , it is just the same 10 first seconds that keeps repeating , so it was quite difficult , and that’s the reason why i’ve been able to make spectograms for only 8 types of whales & not more ( i have to admit that i’m a bit frustrated by that).
by the way i’ll publish the Notebook soon , if u have any questions feel free to ask , i’ll be delighted to help.

2 Likes

I just started with Deep Learning using your FastAI course and am two lessons down.
Found an interesting dataset on Kaggle on different art forms.
This is my first project here.
It predicts the type of art, whether it is a drawing or a painting or something when fed with an image. I achieved an accuracy of 94% while using FastAI.

Thanks Jeremy. Faced some difficulties while using Kaggle and FastAI together, but managed all those and am proud of this notebook, with many more to come :slight_smile:

2 Likes

Thankyou for writing this out.It has been really helpful.

1 Like

Hey, @MicPie is right, data augmentations are not helpful for spectrograms, neither is pretraining with imagenet.

Try this and see if you can improve even more.

  1. set pretrained=False when creating your cnn_learner (this will turn off transfer learning from imagenet which isn’t helpful since imagenet doesn’t have spectrograms)
learn = cnn_learner(data, base_arch=models.resnet34, 
                   metrics=[accuracy], pretrained=False)
  1. Turn off transforms. You do this in the databunch constructor, set tfms = None
  2. Also make sure you are normalizing for your dataset, not imagenet stats. If you have the line .normalize(imagenet_stats), change it to .normalize().
databunch(dl_tfms=None).normalize()

Hope this helps and if you’re especially interested in audio come join us in the Deep Learning With Audio Thread

4 Likes

I spent my weekend working on improving Stack Roboflow. I updated the display of the generated code so it looks more natural (removed a bunch of whitespace noise that was a result of the tokenizer).

I also linked it up with Elasticsearch (search engine is live here for data exploration!) so I could start understanding what it’s outputting. One of the most interesting things I found was that certain terms from the training data are over-represented and others are under-represented in the language model’s output.

There’s a slight bias towards under-sampling a term vs oversampling it:

After digging in a little bit it seems that terms which are common in both the wikitext dataset and my own training set tend to be over-sampled. And ones that are primarily present in my dataset are under-sampled. My hypothesis is that this has to do with transfer-learning.

For example, most oversampled (weighted by frequency of occurrence are:

file-get-contents
do-loops
dos
do-while
2-way-object-databinding
windows-server-2008-r2
windows-server-2008
get-request
http-get
get
gets
get-childitem
apt-get
windows-server-* (6x)
post-redirect-get

And most under-sampled are

jquery-animate
jquery-pagination
jquery-cookie
jquery-plugins
jquery-jtable
struts2-jquery
jquery-tooltip
jquery-traversing
jquery-autocomplete
jquery-datatables

I noted some more details about my findings in this twitter thread.

I am glad that the writing was helpful for you!