@hwasiti I mean for all the notebooks I ever run on my GCPs, htop shows one thread working. I have a 250GB SSD
EDIT: At least half of my post that this replaces was probably bullshit, because I didn’t know htop by default displays threads, not processes. Will research further and post an update. So what I thought I was seeing here didn’t actually exist. Too bad. Sorry, if I confused anyone…
I also observe this problem working with Quick Draw dataset - on GCP, with both P100 and V100 (and not just me. Not sure if it’s related, but there also seem to be a GPU memory leak as well: when trainining with large images, I get CUDA out of memory error after several large epochs.
Hey @adilism
I tried to run your notebook to replicate the error.
In cell 11 it gave me this error:
------------------------------------------------------
NameError            Traceback (most recent call last)
<ipython-input-14-18718420d75b> in <module>
----> 1 class DoodleDataset(DatasetBase):
      2     def __init__(self, df, size=256, is_test=False):
      3         self.drawings = df['drawing'].values
      4         self.size = size
      5         self.is_test = is_test

NameError: name 'DatasetBase' is not defined
I am interested to replicate this error in GCP and in my local pc. Please provide notebooks as more as possible that can be run without too much fiddling so we encourage others to reproduce this error and find whether any differences in platforms. I think if this is confirmed as a bug shown consistently on large datasets, it worths more attention. Real world datasets are always big.
That’s strange.
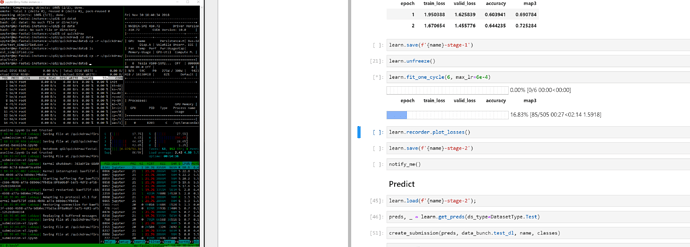
When I run radek’s notebook for the quickdraw comp., I have seen that all 8 processors are working on my GCP instance.
Here is before unfreeze()
Here is after unfreeze() training resnet34:
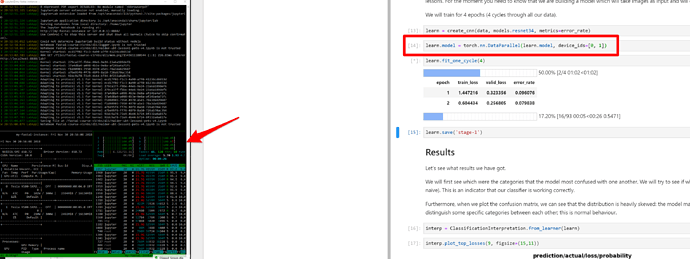
And when I tried running 2 V100 running two versions of this notebook, I can see that almost all processors are maxed out (80-100%)
Processor utilization are definitely not the same (one processor util. is more than the other), but they are all significantly working more than the idle state before running the nb.
I can confirm this. Due to the problems mentioned in this thread I set up a gcloud instance hoping to be faster and have less problems. Now even though I specify 8 workers it only uses one of 8 cores while training and the v100 setup is slower than my home computer. I makes me wanna cry… 
I have set up the machine according to the official setup docs by fastai using the DL image.
Now there seem to be people here (@hwasiti?) for whom it works alright on gcloud. Could it be that this is due to differences in pytorch versions? Could you guys check your pytorch version in gcloud to see if this might make a difference? Mine is pytorch-nightly 1.0.0.dev20181024 py3.6_cuda9.2.148_cudnn7.1.4_0 according to conda list. When I try to install pytorch-nightly to a new env it would give me a release version from today apparently. So maybe something was changed/fixed in the meantime?
i should mention that I have not specified number of workers and let it to be default. Can you try that? Maybe this is the difference between my code and yours…
Here is my installed library versions:
from fastai.utils import *
show_install()


=== Software ===
python version  : 3.7.0
fastai version  : 1.0.30
torch version   : 1.0.0.dev20181120
nvidia driver   : 410.72
torch cuda ver  : 9.2.148
torch cuda is   : available
torch cudnn ver : 7401
torch cudnn is  : enabled

=== Hardware ===
nvidia gpus     : 1
torch available : 1
  - gpu0        : 16130MB | Tesla V100-SXM2-16GB

=== Environment ===
platform        : Linux-4.9.0-8-amd64-x86_64-with-debian-9.6
distro          : #1 SMP Debian 4.9.130-2 (2018-10-27)
conda env       : base
python          : /opt/anaconda3/bin/python
sys.path        :
/home/jupyter/fastai-course-v3/nbs/dl1
/opt/anaconda3/lib/python37.zip
/opt/anaconda3/lib/python3.7
/opt/anaconda3/lib/python3.7/lib-dynload
/opt/anaconda3/lib/python3.7/site-packages
/opt/anaconda3/lib/python3.7/site-packages/IPython/extensions
/home/jupyter/.ipython
Maybe…
There is around 1 month difference between mine and yours version. This is also worth trying to check…
Jeremy mentioned that he is getting slower speed on V100 (cloud?) compared to 1080Ti (local?): here
You can compare your pc or GCP performance with others here
Here is the pet model running on 2 GPUs in parallel utilizing 100% of all processors (V100 x 2):
(lesson 1 notebook without any modifcation.)
I reported the benchmarks for the single and dual GPU performance here.
So, now some further research into our memory problem:
The key thing I cannot wrap my head around is this:
- I am able to run training with num_workers=4 (set on the DataLoader, not the DataBunch) on 10.000 examples. I run that for 3 epochs without problem.
- if I now change the examples to 30.000 and only 1 epoch it crashes.
- the crash happens WAY before the number of iterations is reached that are neccessary to process ONE epoch of 10k examples using otherwise identical settings. Therefore the training itself cannot really be the cause.
- the only difference in the dataloader I can think of is the length of the itemlists and labelists. So how could that lead to such a massive problem? (I mean those are huge and have to be copied into all workers. So this could potentially deplete RAM. Why they are so huge is something to be looked into as well.
Looking into this deeper led to the realization, that just by loading the little over 10 million files into an itemlist, the python process consumes over 3 GB of RAM. I had to read a lot about memory management but what is clear is that pytorch uses fork() to create the worker processes. That means a worker is basically created as a copy of the main process with everything in it. In theory as long as nothing is changed that should mean they share the memory, but in practice as either subprocess or main process change stuff, the memory actually gets copied/duplicated for each process. So if we have a giant main process, that will not be good for forking workers from it!
So, looking into this deeper, the reason why the process is so bloatet, is because all the paths to the files in fastai Itemlists get stored in lists of Path objects. That seems to be a very memory inefficient way of storing things. The question is, why we store the filepaths as lists at all. pathlibs Path.iterdir() offers a generator that has basically zero memory footprint, I am not sure why fastai converts everything into real lists.
So that leads to this situation (10200000 file paths in a list of Path objects):

more than 3 GB of RAM used just for the filepaths!
So, if it is necessary to have lists for some reason and not use generators 2 options at least help the situation:
A) Storing lists of string paths:

-> reducing memory footprint by 2GB (“only” 1.1 GB for storing the filepaths)
B) As normally the path is passed separately, it would be enough to just store the names (or maybe relative dirs). with names only:

reduces memory footprint by another 300 MB.
While having lists in memory worth 800MB is not nice, forking that and creating 8 copies would not overflow my RAM. Copying 5GB processes just 4 times already kills my 16GB system. (5GB because the label list adds another 1.xGB and the learner object adds more.)
Still all of this may just be a side issue and some other major leakage may add to / cause the problem. But still wanted to share this.
Yeah, that makes sense. I was thinking about it but why the children’s processes memory is modified?
Not talking about exact implementation but from a conceptual point of view, we have a read-only dataset, right? It is not modified during the training process, and if each worker should have its own copy of the dataset, it is not really possible to efficiently scale. Like, you need the amount of RAM equal to the size of the dataset meta-information multiplied by the number of workers. That’s not a really efficient way to train models, I would say 
Also if we’re talking about fork(), shouldn’t it make a copy-on-write only for specific memory pages? The paths are static, and the dataset as well so it shouldn’t copy them, right? Only keep references to parent’s pages.
Same here, it seems that my local machine shows better performance than Salamander’s V100 host ![]()
So I can confirm: Upgrading pytorch to the 2018-11-30 build without any other changes now makes it obay the num_workers parameter. So anyone having problems on gcloud with pytorch running only a single process, upgrade pytorch, that should fix it! With the previously installed version (from the DL image) of build 2018-10-24 it always only used one process, num_workers had no effect whatsoever.
And does it help with num_workers > 0 as well?
This is worthwhile to cross post on the GCP thread for other folks.
No, unfortunately it doesn’t. But I have continued monitoring this, and maybe what I stated before (copying the huge lists into the workers) is the actual problem. As you also mentioned, forking a process should not actually copy the entire memory, but rather due to copy-on-write only make “virtual copies” until the main process or the workers modify something and ony then make “pyhsical” copies. So maybe that is actually what is happening here and not a real memory leak. I also don’t understand what would cause “writing” here, but maybe that is what happens (maybe storing/“marking” the last “item delivered” for the iterator somehow is enough?). Anyways, if you look at the two screenshots below, you can see that the memory consumption has gone up (steadily over time) by 3.1 GB. But the processes still show about the same amount of virt. and reserved mem. So the processes don’t actually use more memory (from “their point of view”) but just more memory is actually allocated for real instead of being shared (copy-on-write). This would happen memory page by page I assume, which would explain why the consumption goes up steadily over time?! (Just wild guesses…)
So if anyone knows why the supposed “read only” operations actually make changes, that would be interesting to understand!
Ok, understood, thank you for helping to figure out what is going on!
I’ve decided to write a small custom training loop to see if it show the same memory error. I was running it against MNIST with > 96% accuracy so I guess that probably it is more or less correctly implemented ![]() So I am going to run it using my custom Quick Doodle dataset class to see if it also fails.
So I am going to run it using my custom Quick Doodle dataset class to see if it also fails.
Update: So far the results are not too promising. I do not use any
fastaidependencies to train the model, onlypytorchandtorchvisionbut still getting a gradual increase of consumed RAM during the very first training epoch. I’ll share the memory consumption plot soon.Also, I’ll share the code I am using as soon as make it more readable then it is now. So one could check my implementation and repeat on other machines/versions of PyTorch.
Other folks are getting same issues in the Google doodle competition :
Thank you for the link! Have posted a message on that thread.
I didn’t say that…
Yes that’s a fair comment. For such giant datasets, you should store the filenames and labels in a CSV file, and use the from_csv methods. That will just leave things as strings.


