I’m posting here since as I submitted a PR I’ve been required to talk about it here on fastai dev forum section.
I submitted a pull request with my version of plot_top_losses() which works upon multilabeled datasets. I named it plot_multi_top_losses().
It basically behaves like plot_top_losses(), but since multiple class labels tended to overlap in a grid plot, I preferred plotting a single column with big pics (by default).
Regardless, it plots the first N misclassified samples (sorted by loss magnitude), with predicted class, actual class, loss, and probability.
I hope you’ll accept it.
In time, I’ll try and code the corresponding versions of most_confused() and the remaining stuff.
I’d like to thank @wyquek, @marcmuc and @sariabod for their suggestions about plotting images in a loop.
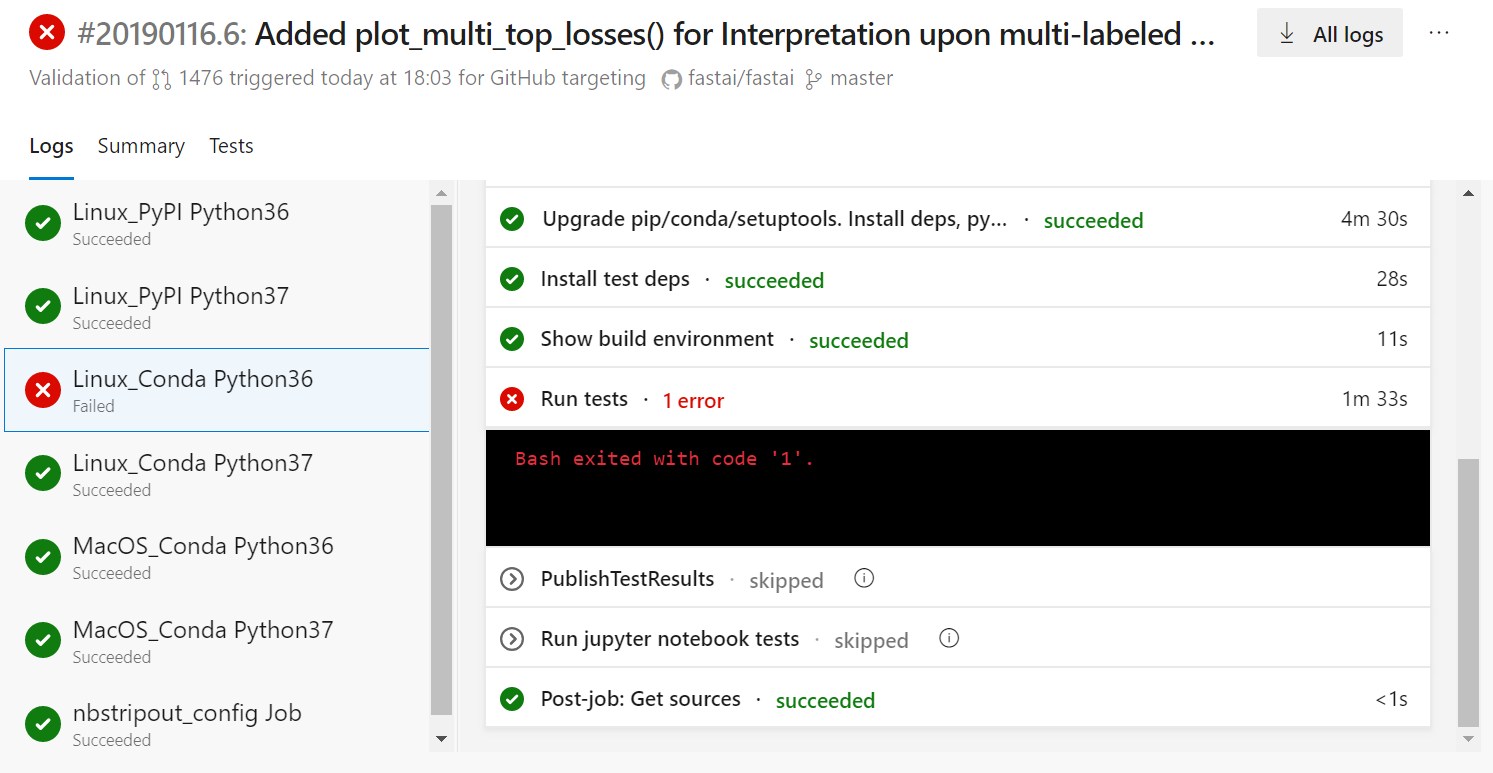
Thanks for your PR. I’ve reviewed it and asked for some changes (mostly to conform with the style guide of the library). Don’t worry about the test, it’s one that sometimes randomly fails.
No, normally you should be able to amend your PR with the corrections. Just make sure you are on a branch for this (don’t ask me how I’m not very good at git so online tutorials are probably better).
Ok, I made all the modifications, and this time on learner.py from the master branch
The I did a commit on my fork. As far as I understood reading a quick tutorial, this should have caused the new file to be submitted via the original PR.
Please, as you have time to spare, take a look and tell me if you see the modified file.
Meanwhile, I’ll go and work upon the doc notebook.
I did put a bit of documentation in the documentation notebook for vision.learner as well, under New Methods - Please document or move to the undocumented section
Hi
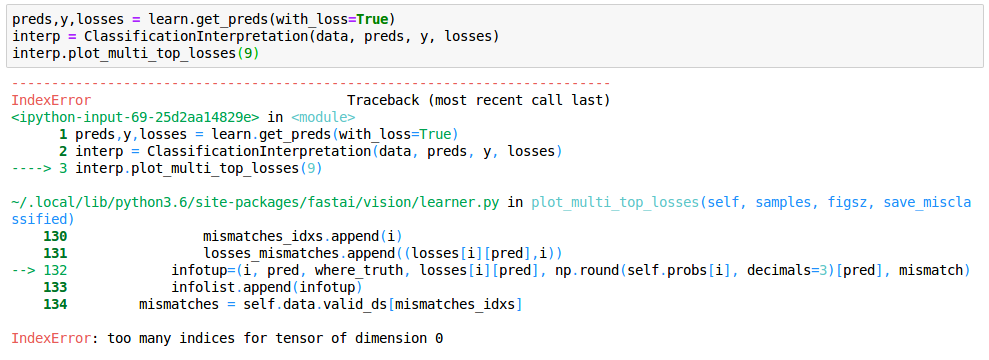
I’m trying to use plot_multi_top_losses().
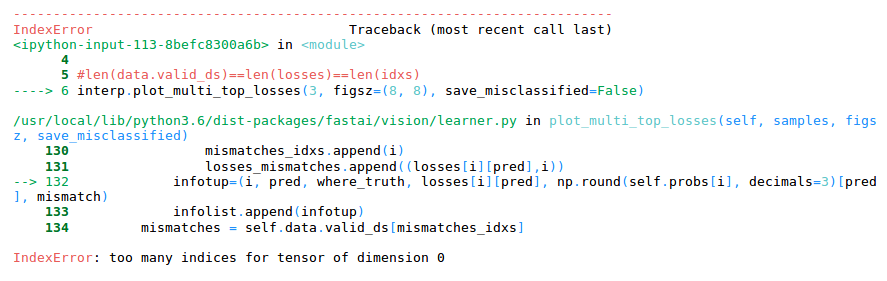
Using; interp.plot_multi_top_losses(3, figsz=(8, 8), save_misclassified=False)
I got the following error:
First of all, make sure you have at least fastai 1.0.42.
I get no errors while using it, but I obviously tested a limited number of use cases. May you provide some additional info? What kind of data are you using it upon? In particular, I’d like to know how your data is labeled.
Last but not least, do what follows:
after having an instance of {your_learner}.interpret(), make the following call:
Not yet. I’ll write it as I have a bit of time. But realize that a confusion matrix is a tool that shows you what your model had failed to correctly classify. plot_multi_top_losses() (given that you manage to get it working) has a parameter that saves all the misclassified stuff in a list, ordered by loss. Then you can check how many items there are, visualize them, etc…
I really apologize for the confusion
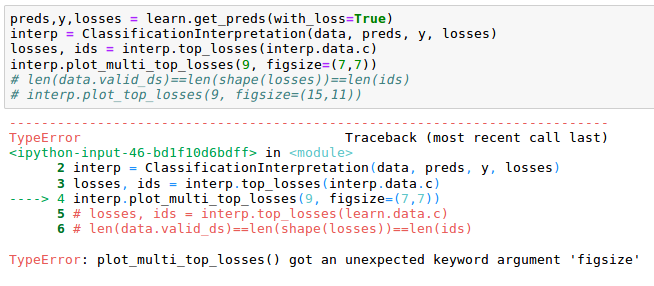
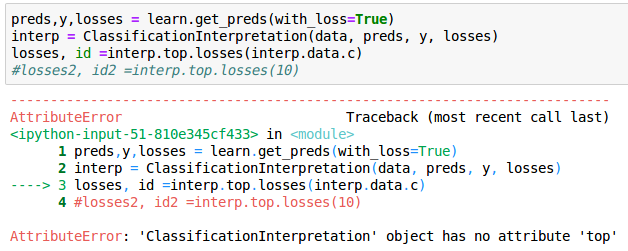
the following solved different issue, but i’m still stuck in the plot_multi_top_losses
I guess my problem is my wrong definition of preds, y, losses or interp
The correct arg for telling it the figure size is figsz (not figsize) .
But I’ll change it to figsize in the next PR for coherence with the other stuff across the library. In any case, use shift+tab to view all the available params, maybe you’ll find other thing which can be interesting for your use case.
Note also:
plot_multi_top_losses() doesn’t need an explicit call to top_losses() beforehand. It’s done internally with the correct params for the use case at hand.
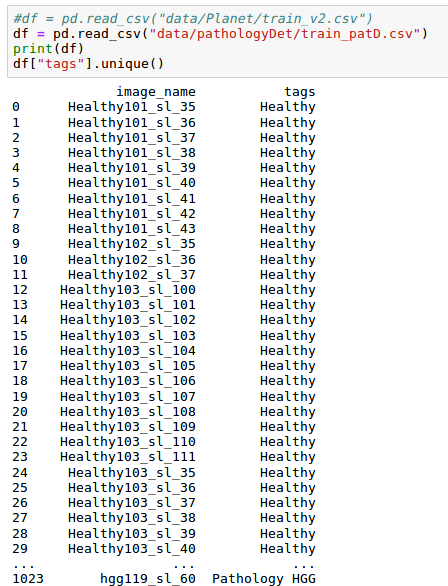
if you call top_losses(data.c) and your data is labeled by the means of a single column (as it seems to be, like in the planet dataset), you will only get the first N entries, where N is the number of classes. Conversely, if you were dealing with one-hot labeling, a call to top_losses(data.c) would have yielded the whole matrix of losses, where you would have had the loss for each class along the row axis.