Python version
import matplotlib.pyplot as plt

fig, ax = plt.subplots(nrows=1, ncols=1, figsize = (6, 6))

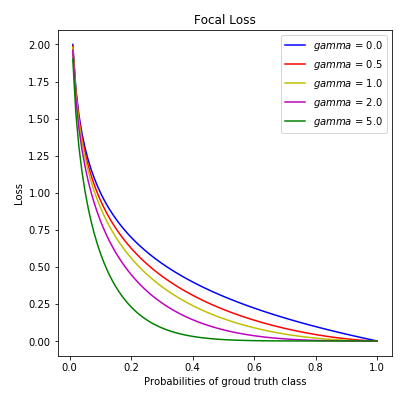
pt = np.arange(0.00, 1.01, step= 0.01)
CE = -np.log10(pt)

# legend color: gamma
g = {'b': 0.0, 'r': 0.5, 'y': 1.0, 'm': 2.0, 'g': 5.0}

for i in g:
    #print(i, g[i])
    FL = (1-pt)**g[i]*CE
    ax.plot(pt, FL, c = i, label = '$gamma$ = '+str(g[i]))

ax.legend()
ax.set_xlabel('Probabilities of groud truth class')
ax.set_ylabel('Loss')
ax.set_title('Focal Loss')
