Thank you for sharing the domain knowledge.
How is “sequence” different from image?
Thank you for sharing the domain knowledge.
How is “sequence” different from image?
Which, if any, of the data augmentation techniques discussed by Jeremy do you expect would be valid, or else inappropriate, for this use case?
TL;DR A “sequence” often simply describes the manner of acquiring a single stack of images.
Abnormal fluid is often associated with pathology. There is normally some fluid in the knee joint capsule, but too much fluid often indicates a problem.
This suggests that we may need a way of detecting extent of inflammation relative to the capsule extent, rather than mere presence. Is this correct? Are combinations of convolution filters as in ResNet adequate to that task? If not, are there known effective approaches to the problem?
If it’s easier to point me to papers, feel free 
In our paper on DeepSPINE, we were looking at a fluid filled sac (the thecal or dural sac, in which the spinal cord and spinal nerves live) and more-or-less trying to train the network to determine it’s relative size, which is (with some hand-waving) how stenosis grading works. So, I suspect special techniques won’t be necessary, that the degree of joint fluid will be convolved into some feature(s) the network evaluates.
Note: you won’t see my name on the DeepSPINE paper, because I joined the project after the technical manuscript had already been submitted, so I use “we” a little liberally when I refer to this work.
Interesting. Thank you very much for the education.
One of the first things we’ll want to do is some data exploration. Might you have jupyter notebooks you could share with the team that we could use to accelerate our exploration of the MRNet data? I expect many of the tasks you and your coauthors did could be useful to our getting oriented with the data as well.
What is the format of the image files? I haven’t requested access to the data yet.
File extension is .npy
So, NumPy arrays I guess. Haven’t examined them yet…
I am also interested and can contribute domain expertise as a musculoskeletal radiologist.
I provide domain knowledge, for my “expertise” is in Neuroradiology. @agentili provides domain expertise. As such, feel free to correct me if I’ve gone a-stray…or simply add your preferences, if you find certain sequences to be more useful for certain tasks.
NumPy arrays, I guess.
We usually work with *.dcm files (DICOM format) and use a DICOM viewer - such as Osirix or RadiAnt - for data exploration.
I can try to put a Jupyter nb together over the next day or so, when I get a little free time.
Perhaps just extracting a to-do list from your DICOM workflow would be useful to us, so we know from your domain expertise the critical things to check.
Here’s hoping that the fresh if naive eyes of those of us without domain expertise proves useful as well…
That’s great to know - was this on Windows? Pranav did email back but just recommended trying on a non-windows machine so maybe I’ll try it on Floydhub.
Great to see the activity here! I spent a few more hours this afternoon researching and wanted to throw out a few more ideas concepts and hopefully we can get going after that.
Possible additional ideas re: architecture:
1 - I saw two papers using Super resolution on MRI images in order to get better classification results. (2x and 4x image resolution enhancements). I believe we will have an updated FastAI super-resolution portion in one of the next classes here, so that might be an interesting pre-processing step to increase our accuracy. (@nswitanek - since you have the images, are they clear or would super resolution be worth investigating?)
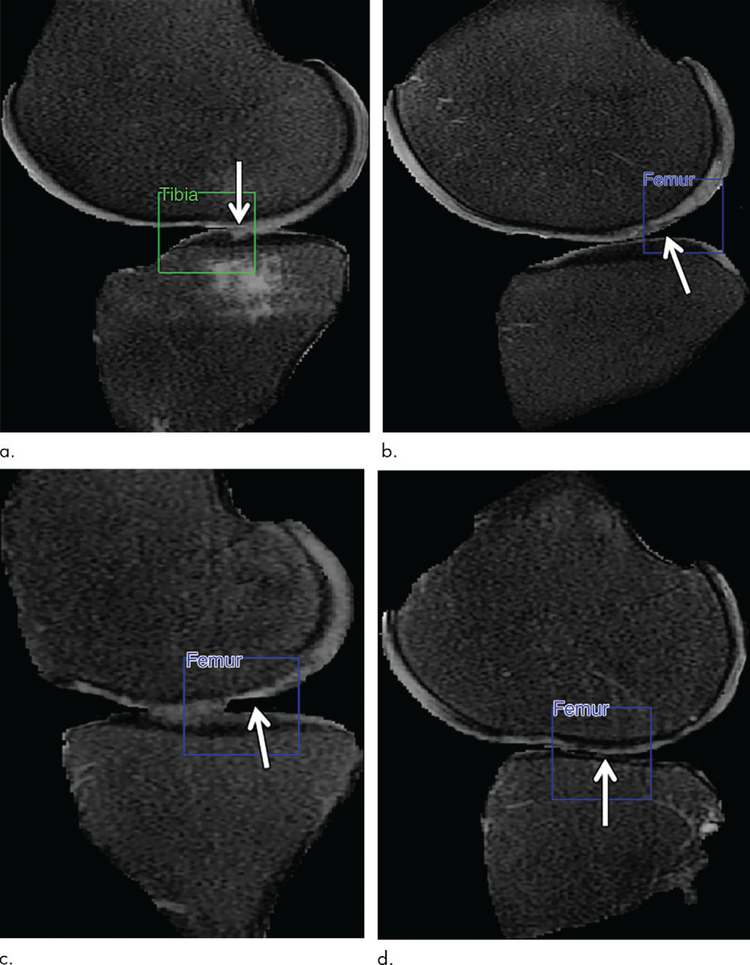
2 - There really is not much in terms of knee MRI and deep learning (vs tons for brain MRI and deep learning). I mostly found Stanfords paper from their project entry and one from earlier using a sort of UNet. I did want to show one image from that paper so we have some initial examples of what we are trying to find:
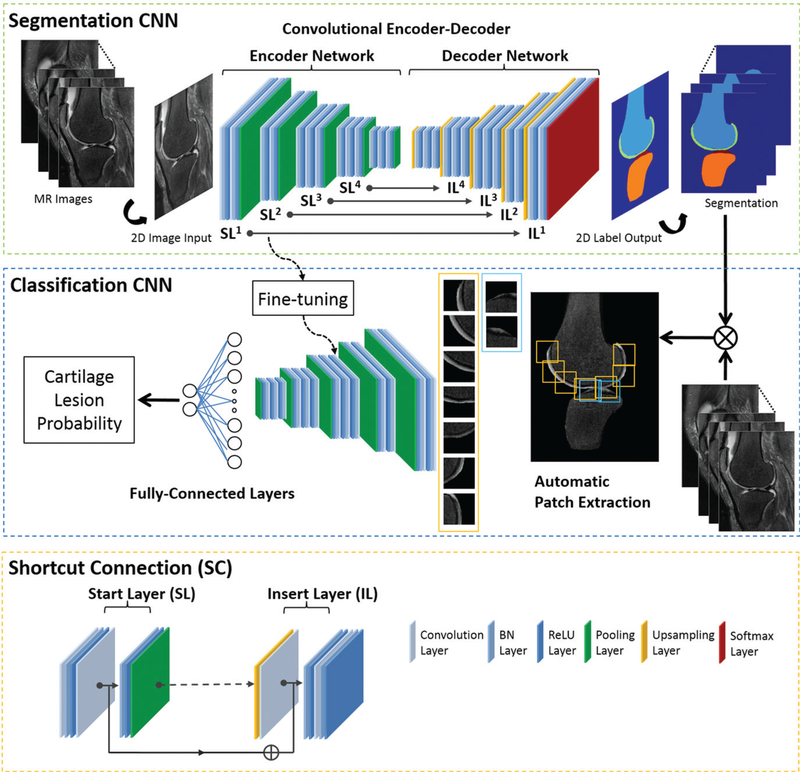
and their architecture (it scored well, based on VGG surprisingly) - this was just for cartilage though, not ACL or abnormality:
3 - On the good news - one paper tested out using a CNN pretrained on ImageNet and then retraining with a small set of MRI images…vs a CNN fully trained on only MRI. They found the ImageNet one outperformed the dedicated MRI trained one, so that’s great for us since we’ve all used transfer learning.
4 - Segmentation first, or direct classification? Several papers used segmentation and then classification… not sure what is better here.
Depending on architecture selection, we could end up with multiple teams/projects b/c in most specialized version we would have:
Super resolution of imagery-> Data augmentation(?) → Segmentation → Classification
Or we just have multiple classification systems leveraging same images but using different priorities ala @neuradai 's excellent proposal:
I believe tomorrow’s class or next week’s, we’ll be building ResNet from scratch with the latest/greatest FastAI 1.2 so that might give us a first chance to make a small dataset and try out the 3 channel model pretty quickly?
btw - these boards keep blocking me from replying more than 2 or 3 times, but did want to say thanks a bunch to @neuradai for the domain knowledge posts (very helpful!) and also thanks to @melonkernel for posting about this competition and starting this project, and @rsrivastava and @tcapelle for joining in…and very excited we have a radiologist interested in helping - thanks to @agentili !
I really hope we can beat out the Stanford team and make some waves for FastAI in doing so ![]()
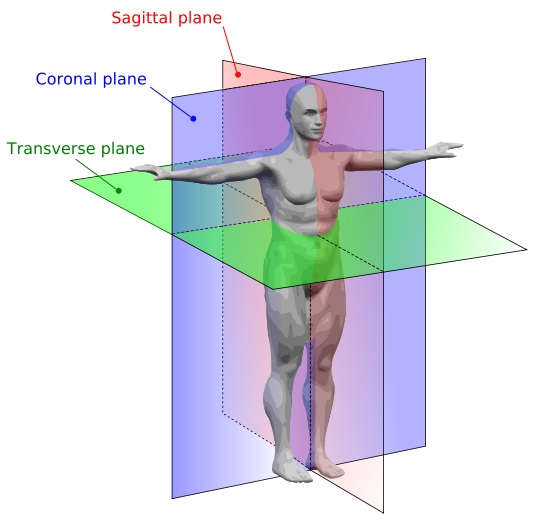
Oh and since I had to double check some of these medical terms, here’s the layout of what sagitall (or as I would term it, side view), coronal (front view) and axial or transverse (top down) are:
Here is a paper I found on Knee Analysis Using CNN https://arxiv.org/pdf/1703.09856.pdf . But this paper is using X-Ray Vs MRI.
So we have a few questions.
Really nice. Hope you get your guidance.
To know about knee
MRI

This picture is very helpful
I just found this paper on LiSHT, a possibly better activation than ReLU, Swish, etc. from January. It tested out better on a number of datasets and they used ResNet for it…so I’ll do some more testing in our class notebooks with it but this might give us another edge here.
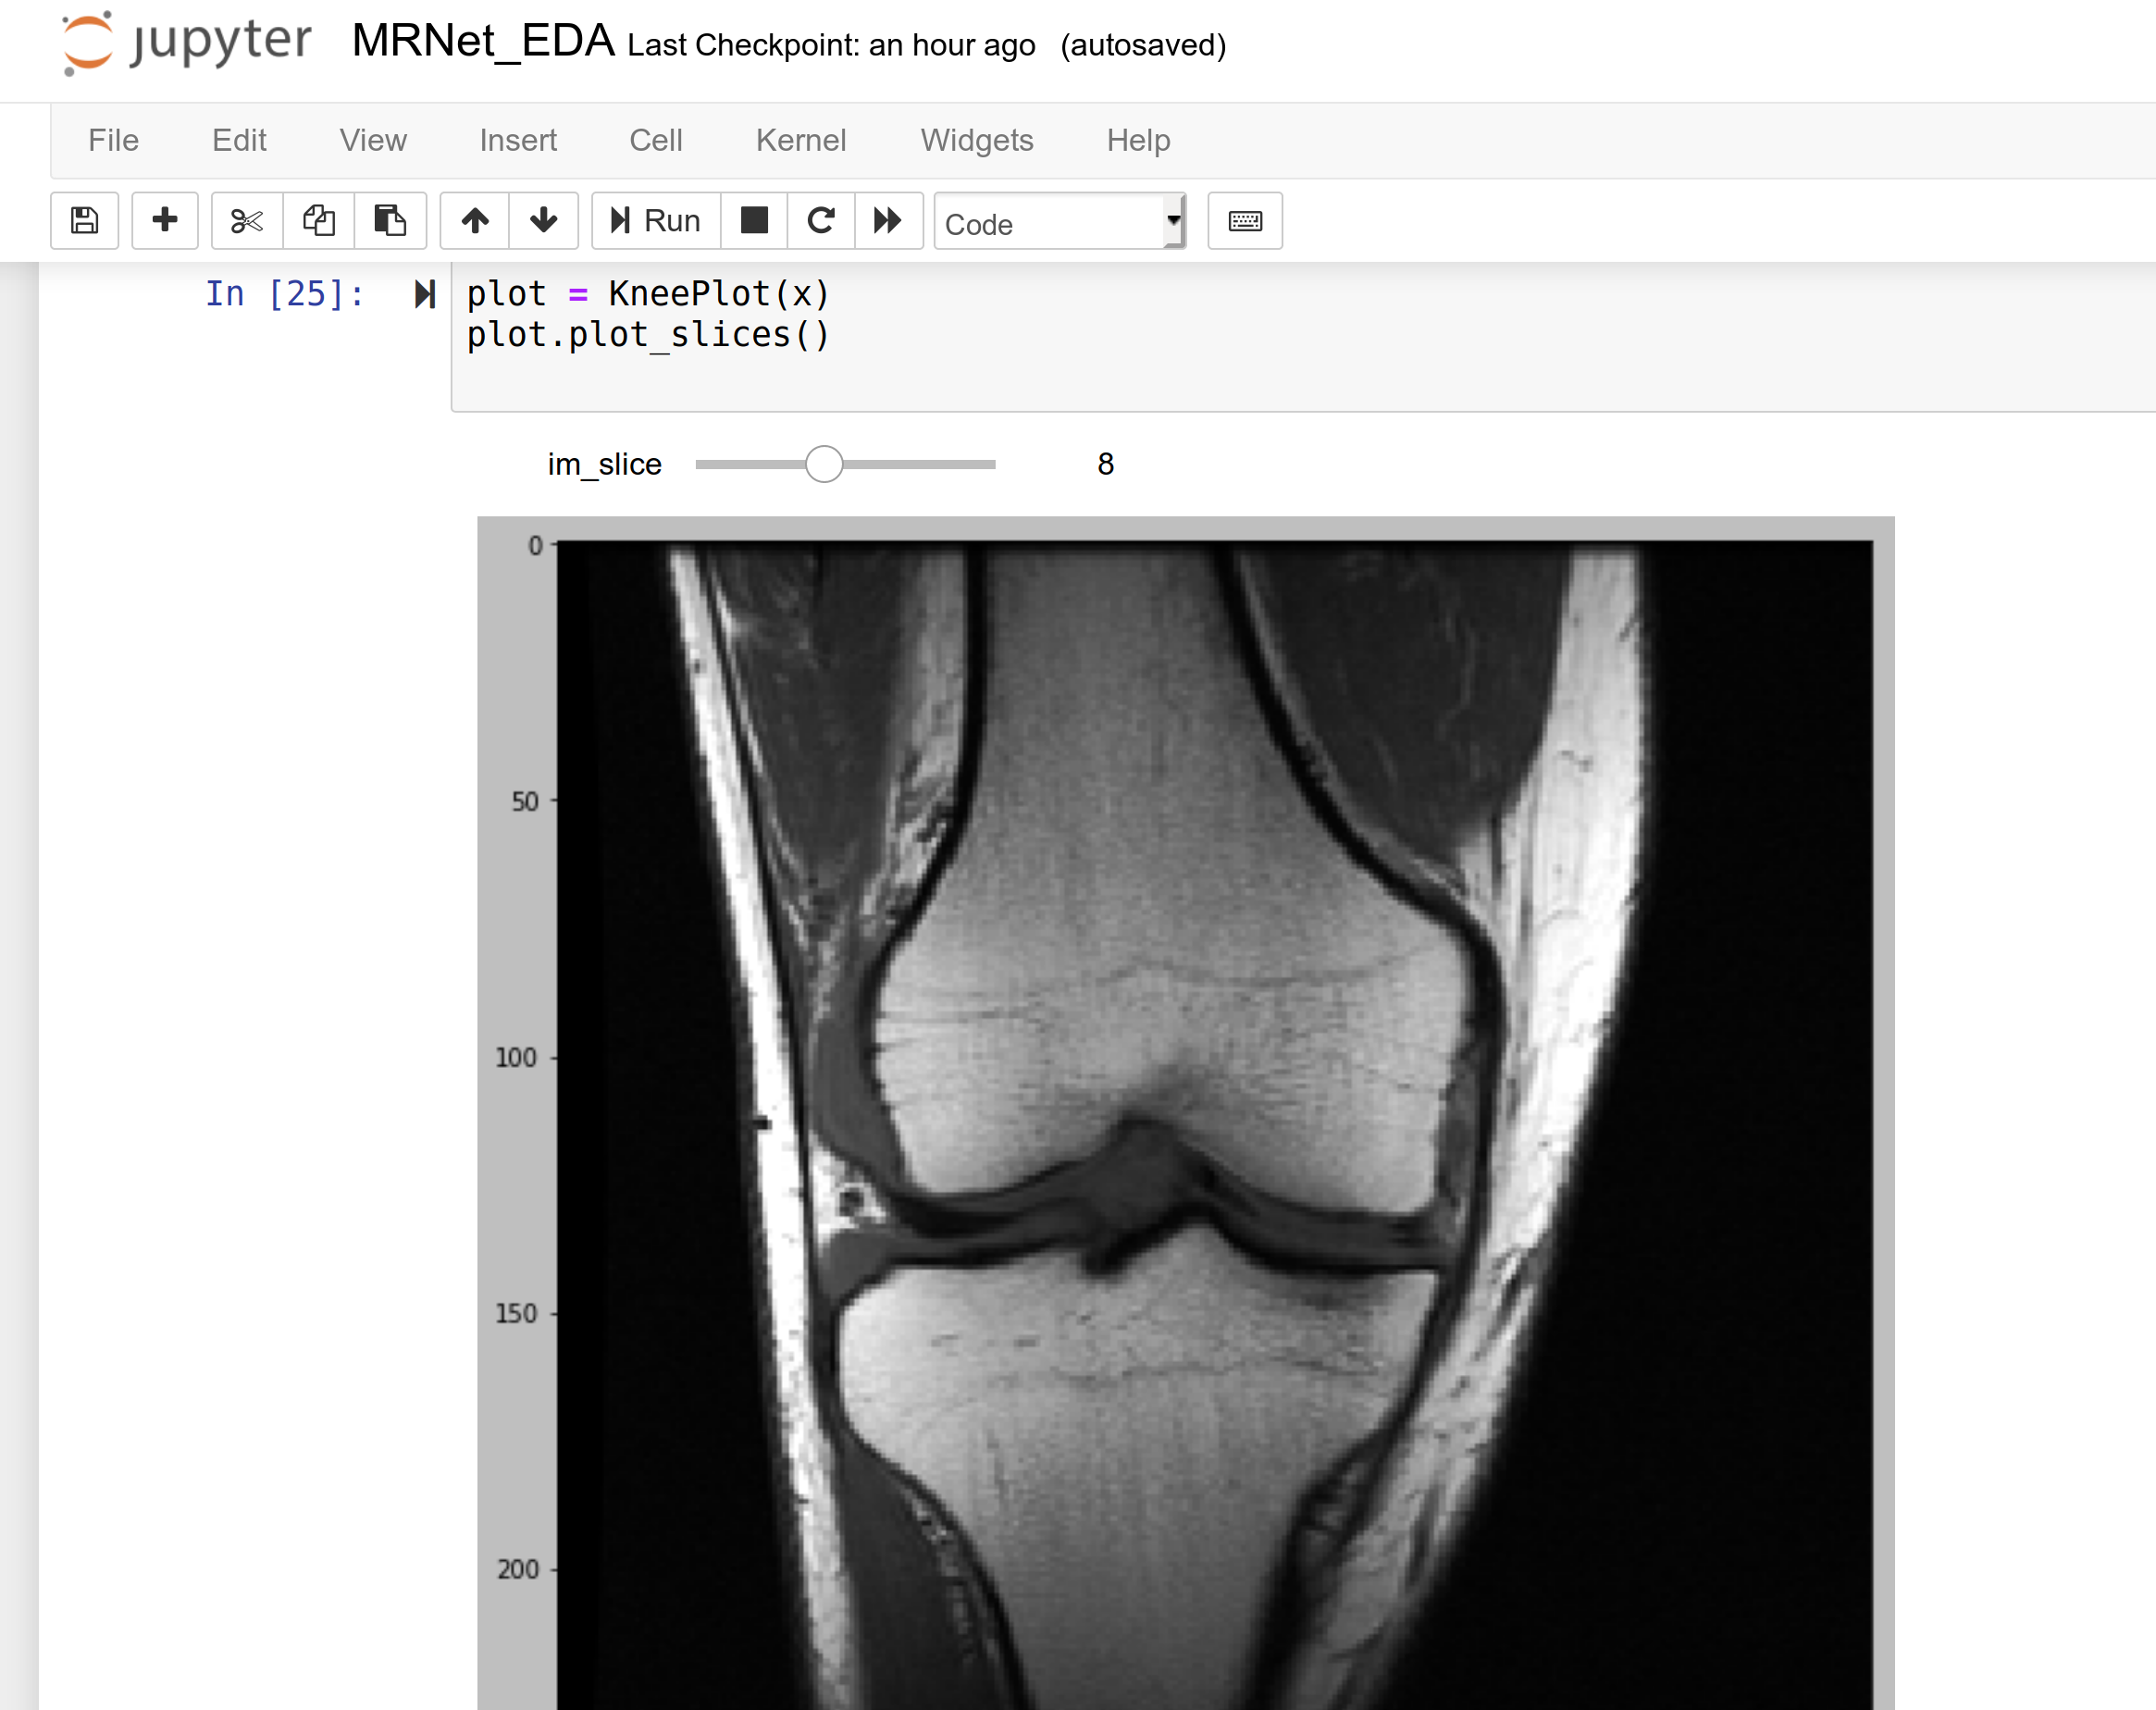
Got a chance to download and briefly review the data this morning. Here’s a screenshot from the EDA nb I’m putting together with the code used to generate the plot below.
from ipywidgets import interactive
from IPython.display import display

plt.style.use('grayscale')

class KneePlot():
    def __init__(self, x, figsize=(10, 10)):
        self.x = x
        self.slice_range = (0, self.x.shape[0] - 1)
        self.resize(figsize)

    def _plot_slice(self, im_slice):
        fig, ax = plt.subplots(1, 1, figsize=self.figsize)
        ax.imshow(self.x[im_slice, :, :])
        plt.show()

    def resize(self, figsize):
        self.figsize = figsize
        self.interactive_plot = interactive(self._plot_slice, im_slice=self.slice_range)
        self.output = self.interactive_plot.children[-1]
        self.output.layout.height = '{}px'.format(60 * self.figsize[1])

    def show(self):
        display(self.interactive_plot)
With this code, you can generate the interactive plot I have shown, so you can scroll through the images and get a sense of what we’re looking at.
When I have a little more time, I’ll send a link to the full EDA nb.