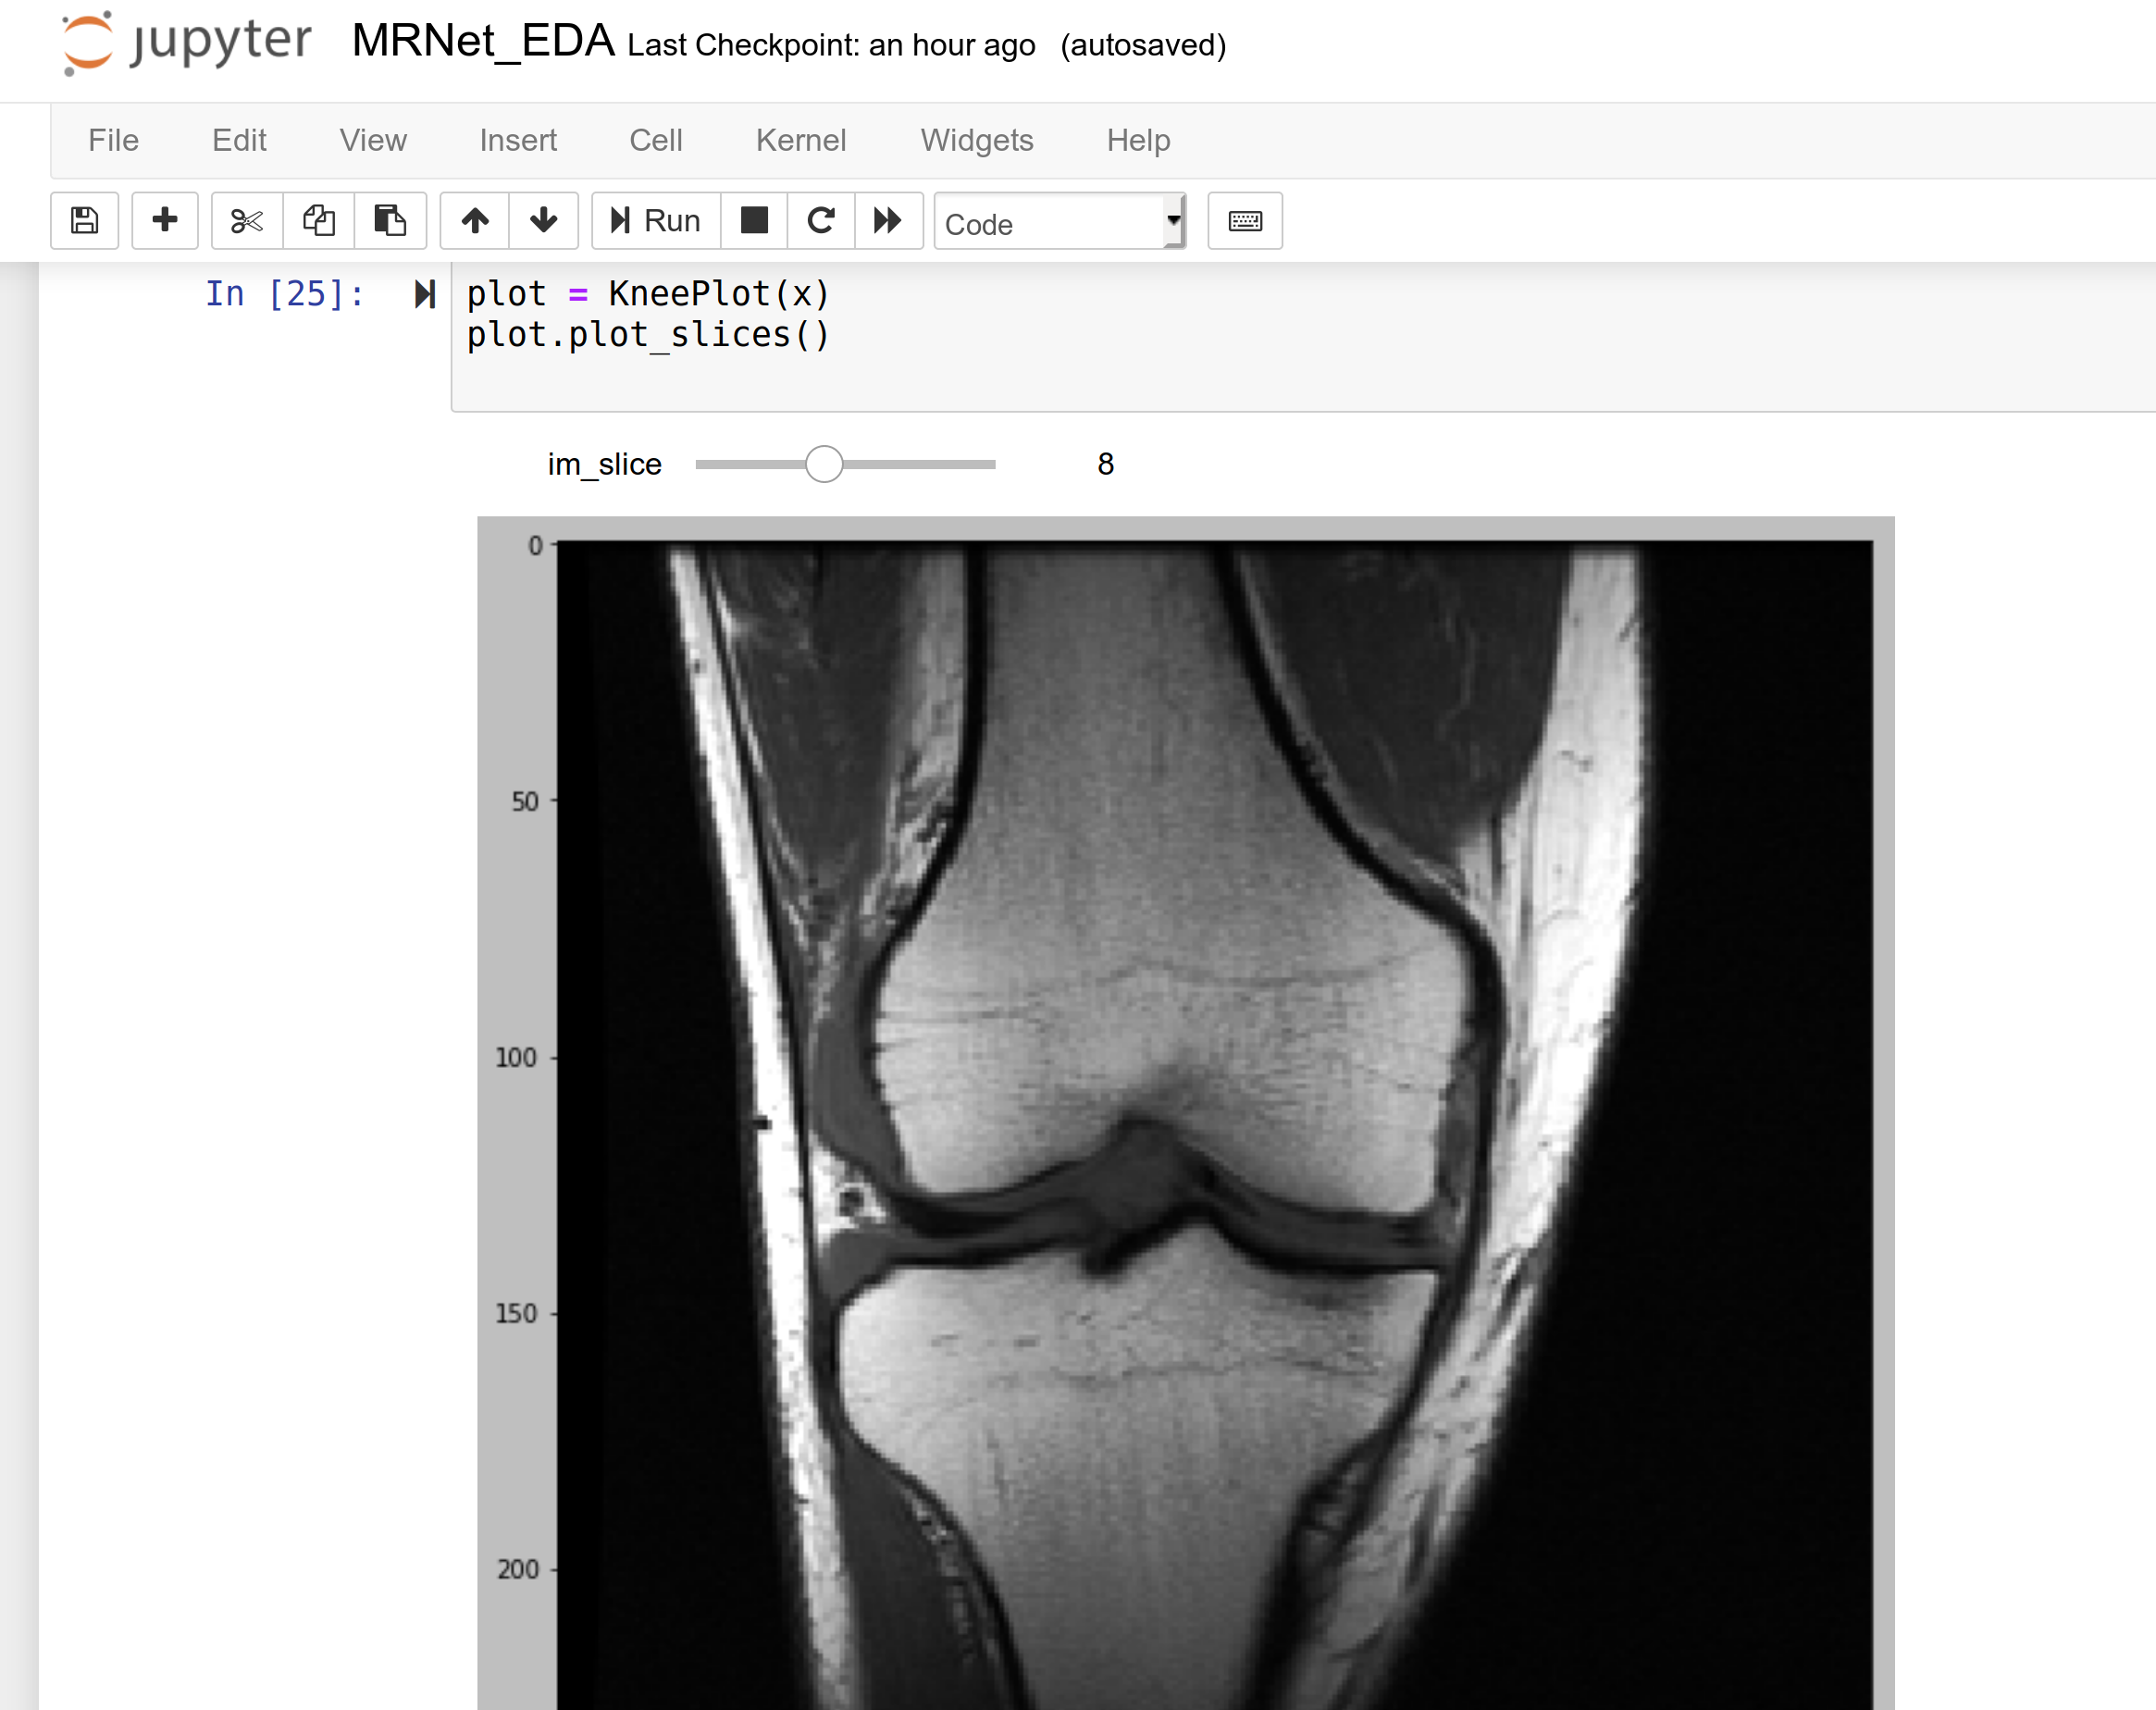
Got a chance to download and briefly review the data this morning. Here’s a screenshot from the EDA nb I’m putting together with the code used to generate the plot below.
from ipywidgets import interactive
from IPython.display import display

plt.style.use('grayscale')

class KneePlot():
    def __init__(self, x, figsize=(10, 10)):
        self.x = x
        self.slice_range = (0, self.x.shape[0] - 1)
        self.resize(figsize)

    def _plot_slice(self, im_slice):
        fig, ax = plt.subplots(1, 1, figsize=self.figsize)
        ax.imshow(self.x[im_slice, :, :])
        plt.show()

    def resize(self, figsize):
        self.figsize = figsize
        self.interactive_plot = interactive(self._plot_slice, im_slice=self.slice_range)
        self.output = self.interactive_plot.children[-1]
        self.output.layout.height = '{}px'.format(60 * self.figsize[1])

    def show(self):
        display(self.interactive_plot)
With this code, you can generate the interactive plot I have shown, so you can scroll through the images and get a sense of what we’re looking at.
When I have a little more time, I’ll send a link to the full EDA nb.