Update 4
Why is there a turn-around on the Learning Rate/Loss?
What does it indicate?
How to fix it?
Update 3
I was thinking that my model might be over-fitting. So I decreased my epochs to 12 and keep using the same lr: (1e-8 to 1e-5). Surprisingly, all error_rate for each epoch became 0! Why?? But the cursed train_loss ups-and-downs persist.
| epoch | train_loss | valid_loss | error_rate | time |
|---|---|---|---|---|
| 0 | 0.000218 | 0.000193 | 0.000000 | 01:29 |
| 1 | 0.000667 | 0.000095 | 0.000000 | 01:31 |
| 2 | 0.004174 | 0.000097 | 0.000000 | 01:29 |
| 3 | 0.001321 | 0.000087 | 0.000000 | 01:30 |
| 4 | 0.001333 | 0.000151 | 0.000000 | 01:29 |
| 5 | 0.001109 | 0.000110 | 0.000000 | 01:29 |
| 6 | 0.000294 | 0.000095 | 0.000000 | 01:30 |
| 7 | 0.000113 | 0.000079 | 0.000000 | 01:29 |
| 8 | 0.000556 | 0.000280 | 0.000000 | 01:30 |
| 9 | 0.000861 | 0.000160 | 0.000000 | 01:30 |
| 10 | 0.000789 | 0.000072 | 0.000000 | 01:30 |
| 11 | 0.001177 | 0.000126 | 0.000000 | 01:29 |
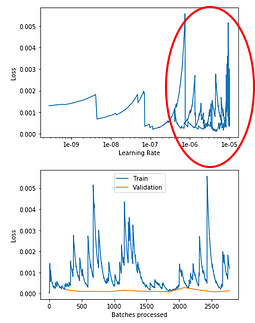
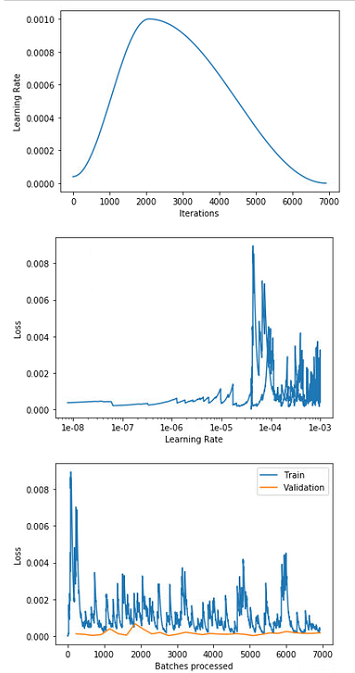
and the plots:
Please help.
Update 2
Updated to use smaller Learning Rate:
learn.fit_one_cycle(30, max_lr=slice(1e-8,1e-3))
| epoch | train_loss | valid_loss | error_rate | time |
|---|---|---|---|---|
| 0 | 0.006239 | 0.000118 | 0.000000 | 01:30 |
| 1 | 0.000423 | 0.000087 | 0.000000 | 01:29 |
| 2 | 0.001073 | 0.000031 | 0.000000 | 01:29 |
| 3 | 0.000531 | 0.000078 | 0.000000 | 01:29 |
| 4 | 0.000841 | 0.000396 | 0.000000 | 01:29 |
| 5 | 0.001923 | 0.000126 | 0.000000 | 01:29 |
| 6 | 0.000958 | 0.000046 | 0.000000 | 01:29 |
| 7 | 0.001429 | 0.000668 | 0.000532 | 01:29 |
| 8 | 0.002065 | 0.000368 | 0.000000 | 01:28 |
| 9 | 0.001127 | 0.000116 | 0.000000 | 01:29 |
| 10 | 0.001648 | 0.000192 | 0.000000 | 01:29 |
| 11 | 0.001007 | 0.000020 | 0.000000 | 01:30 |
| 12 | 0.001138 | 0.000095 | 0.000000 | 01:29 |
| 13 | 0.002589 | 0.000206 | 0.000000 | 01:29 |
| 14 | 0.000566 | 0.000140 | 0.000000 | 01:30 |
| 15 | 0.000513 | 0.000075 | 0.000000 | 01:29 |
| 16 | 0.001141 | 0.000137 | 0.000000 | 01:30 |
| 17 | 0.000666 | 0.000105 | 0.000000 | 01:29 |
| 18 | 0.000907 | 0.000095 | 0.000000 | 01:29 |
| 19 | 0.000439 | 0.000128 | 0.000000 | 01:30 |
| 20 | 0.002619 | 0.000094 | 0.000000 | 01:28 |
| 21 | 0.000493 | 0.000021 | 0.000000 | 01:29 |
| 22 | 0.000287 | 0.000085 | 0.000000 | 01:30 |
| 23 | 0.000602 | 0.000167 | 0.000000 | 01:30 |
| 24 | 0.000796 | 0.000142 | 0.000000 | 01:29 |
| 25 | 0.003357 | 0.000249 | 0.000000 | 01:29 |
| 26 | 0.000247 | 0.000181 | 0.000000 | 01:31 |
| 27 | 0.000233 | 0.000143 | 0.000000 | 01:30 |
| 28 | 0.000351 | 0.000143 | 0.000000 | 01:30 |
| 29 | 0.000333 | 0.000173 | 0.000000 | 01:29 |
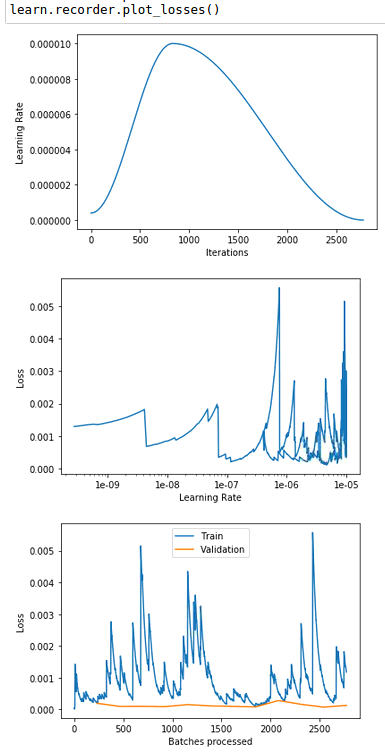
and here are the plots:
As you can see that the last graph, the train_loss is really bumpy. Why is it?
Update 1
I updated my lr according to " you want to be 10x back from that point, regardless of slope." and set it to
max_lr=-slice(1e-3, 1e-2)
And here is what I got
| epoch | train_loss | valid_loss | error_rate | time |
|---|---|---|---|---|
| 0 | 0.015970 | 0.017857 | 0.006581 | 09:13 |
| 1 | 0.011153 | 0.001758 | 0.000774 | 09:06 |
| 2 | 0.009547 | 0.002958 | 0.001549 | 09:08 |
| 3 | 0.014085 | 0.009251 | 0.003871 | 09:08 |
| 4 | 0.009021 | 0.005344 | 0.001161 | 09:08 |
| 5 | 0.009346 | 0.001023 | 0.000387 | 09:09 |
| 6 | 0.009408 | 0.006873 | 0.001161 | 09:10 |
| 7 | 0.019754 | 0.009482 | 0.001936 | 09:10 |
| 8 | 0.009297 | 0.017937 | 0.003484 | 09:09 |
| 9 | 0.007004 | 0.012227 | 0.002323 | 09:10 |
| 10 | 0.009249 | 0.019334 | 0.003097 | 09:10 |
| 11 | 0.003321 | 0.010252 | 0.001549 | 09:11 |
| 12 | 0.010526 | 0.008424 | 0.000774 | 09:10 |
| 13 | 0.007408 | 0.005029 | 0.001161 | 09:11 |
| 14 | 0.005817 | 0.007674 | 0.001161 | 09:12 |
| 15 | 0.005499 | 0.005278 | 0.000774 | 09:12 |
| 16 | 0.002524 | 0.009412 | 0.001549 | 09:13 |
| 17 | 0.006877 | 0.000892 | 0.000387 | 09:14 |
| 18 | 0.003429 | 0.001538 | 0.000774 | 09:14 |
| 19 | 0.002009 | 0.003047 | 0.000387 | 09:14 |
| 20 | 0.003262 | 0.059952 | 0.001936 | 09:15 |
| 21 | 0.005491 | 0.000256 | 0.000000 | 09:15 |
| 22 | 0.001810 | 0.002114 | 0.000387 | 09:16 |
| 23 | 0.002307 | 0.017701 | 0.002323 | 09:17 |
| 24 | 0.002877 | 0.002651 | 0.000774 | 09:17 |
| 25 | 0.001547 | 0.001351 | 0.000387 | 09:18 |
| 26 | 0.000105 | 0.002169 | 0.000387 | 09:18 |
| 27 | 0.000331 | 0.001692 | 0.000387 | 09:18 |
| 28 | 0.000755 | 0.001204 | 0.000387 | 09:19 |
| 29 | 0.000563 | 0.001605 | 0.000387 | 09:20 |
And the plots
What does this mean?
As you can see in the 2nd graph that
- the loss was very good starting from 1e-08, but I never set my lr to 1e-08, why do I see this??
- the loss went up and down between 1e-07 and 1e-04 and eventually it soared to almost 0.05 when the lr came back around 4e-05. What does this mean? Overfitting? How come initially when the Learning Rate was around the same value(4e-05) the loss looked okay?
- from the Batches processed/Loss, I can see that train_loss and valid_loss went together and looked really well. This means the model was trained very well? If it was well trained, why the shot-up at the end of graph 2?
- I have followed the rule about picking up the correct lr, why does not it work? May I conclude that the lr_find() does not work properly?
Here is my lr_find() plot
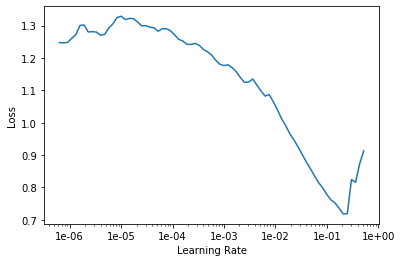
then according to its graph, I picked up the steepest slope section: 1e-2 to 1e-1 as my lr.
Here is the code:
learn.fit_one_cycle(20, max_lr=slice(1e-2,1e-1))
But here is what I got during training
| epoch | train_loss | valid_loss | error_rate | time |
|---|---|---|---|---|
| 0 | 0.017293 | 0.022473 | 0.006581 | 09:11 |
| 1 | 0.063442 | 0.014093 | 0.002323 | 09:08 |
| 2 | 0.126091 | 0.042731 | 0.005033 | 09:07 |
| 3 | 0.234853 | 0.377233 | 0.005033 | 09:04 |
| 4 | 0.447723 | 0.915372 | 0.007356 | 09:04 |
| 5 | 0.379212 | 3.196698 | 0.004646 | 09:03 |
| 6 | 0.347551 | 0.051682 | 0.003097 | 09:02 |
| 7 | 0.503262 | nan | 0.015099 | 09:03 |
| 8 | 0.335354 | 4.139624 | 0.004259 | 09:03 |
| 9 | 0.35612 | nan | 0.024777 | 09:03 |
| 10 | 0.182476 | 0.051487 | 0.00271 | 09:03 |
| 11 | 0.149758 | 0.24712 | 0.00813 | 09:04 |
| 12 | 0.155585 | 0.019171 | 0.000387 | 09:03 |
| 13 | 0.076157 | 0.063323 | 0.00542 | 09:04 |
| 14 | 0.040974 | nan | 0.003097 | 09:03 |
| 15 | 0.019798 | 0.013353 | 0.001161 | 09:03 |
| 16 | 0.013059 | 0.954418 | 0.001549 | 09:04 |
| 17 | 0.007322 | 0.031414 | 0.000774 | 09:05 |
| 18 | 0.002674 | 0.168147 | 0.001936 | 09:05 |
| 19 | 0.004688 | 0.322064 | 0.001161 | 09:04 |
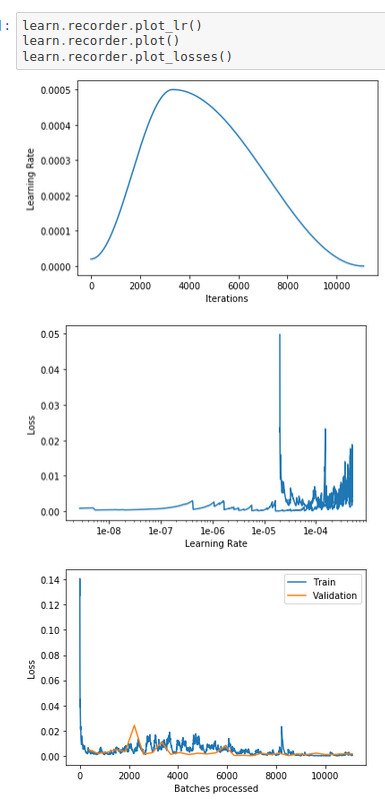
And here are the plots
learn.recorder.plot_lr()
learn.recorder.plot()
learn.recorder.plot_losses()


As you can see the valid_loss is getting worse cyclically.
So my conclusion is lr_find() method doesn’t work properly.
Could someone help to verify it please?
If you want to see the entire code, here it is
only difference is I use to_fp16()
learn = cnn_learner(data, models.resnet50, metrics=error_rate).to_fp16()
