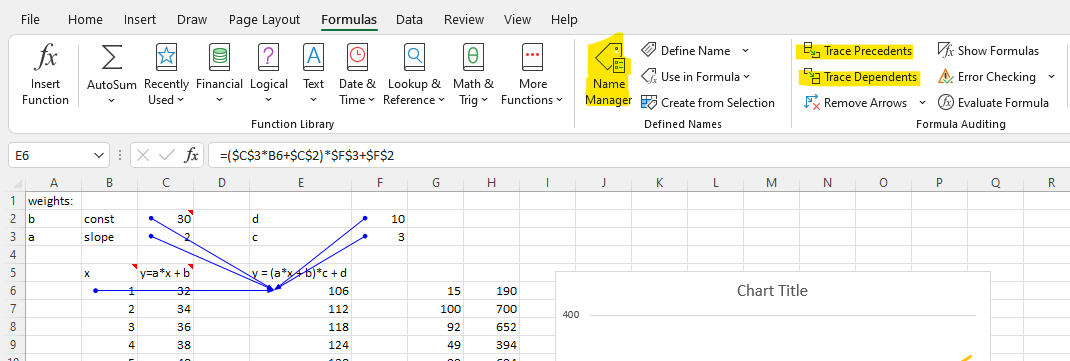
Tips: Trace Precedents and Trace Dependents are debuggers in Excel. Use Remove Arrows (a bottom below) to remove blue lines.
3 Likes
Thanks a lot Sarada!
You are very right, and it does boil down to a simple linear function with just larger constant ac and (cb + d). Also maybe the exploding error from early on probably is due to the large difference between ac and my initial value 1.
So, what was I trying to do? How did I come up with this y = c*(ax+b)+d?
I want to build a slightly more complex model to find our target y = 2x + 30. Jeremy used the simplest model y = ax + b with two parameters a and b, and I want my slightly more complex model to have more than 2 parameters. If we can think of the model in terms of neurons, then I can picture the simplest model as a single neuron with a and b as weights (without activation function). If so, could a slightly more complex model be two connected neurons (one has a and b and the other has c and d) without activation functions?
I wonder whether the missing of an activation function is the reason why two neurons are collapsed into one neuron essentially.
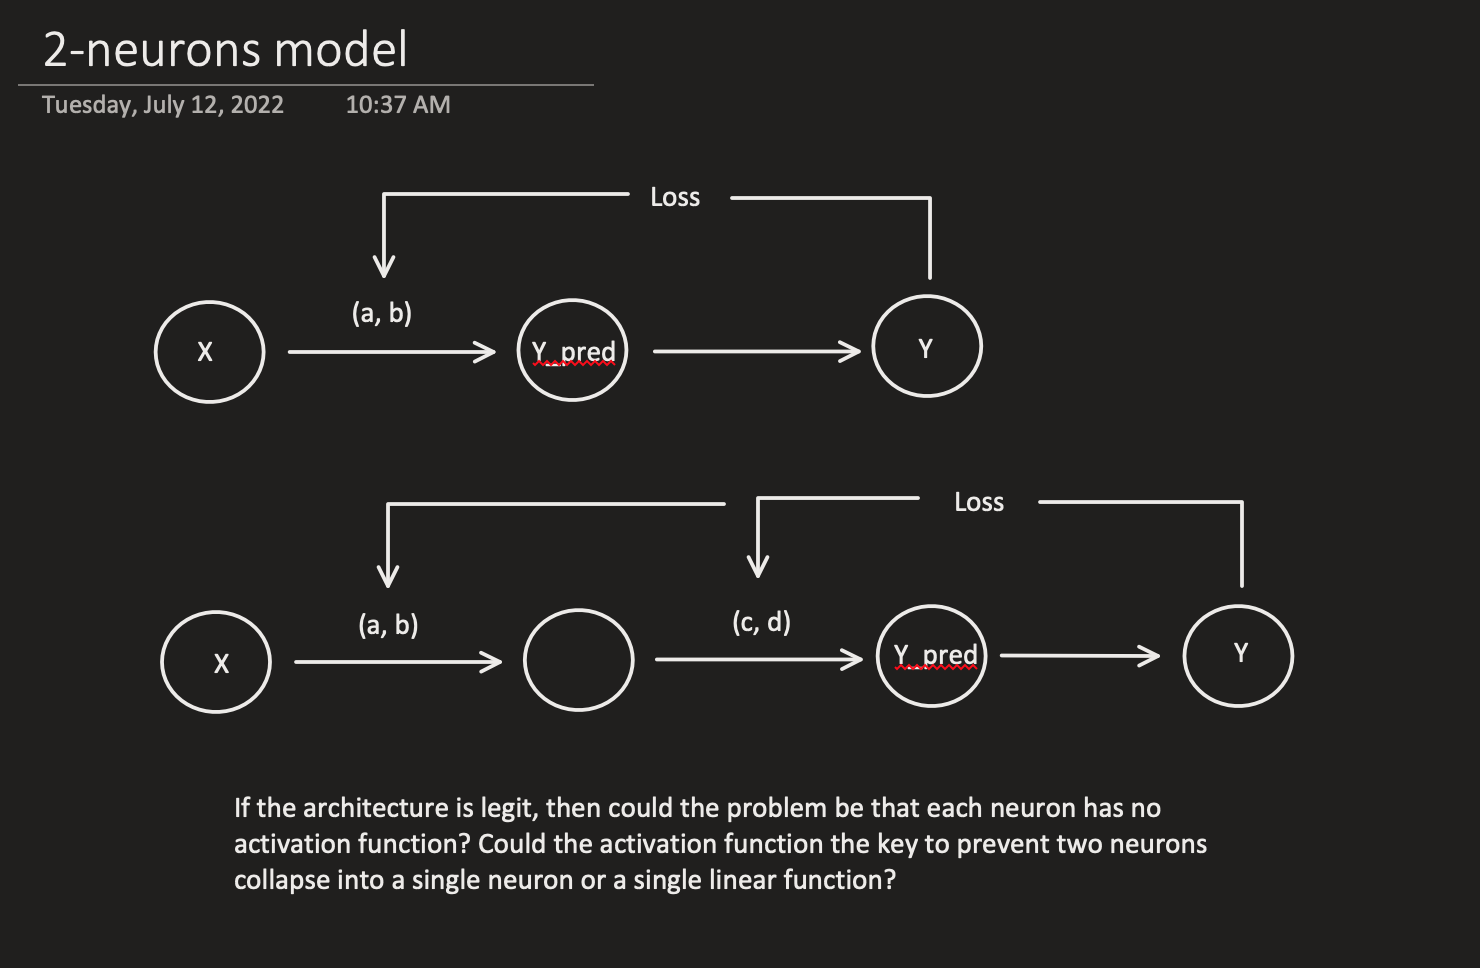
Then if I do add one activation function such as a ReLU to the first neuron, would it prevent the collapse? I wonder how would I prove it? If it does not collapse, then the formula to calculate derivatives below should be working I assume. (I will keep experiment to explore on these questions)
1 Like
Great tips, thanks a lot!
1 Like
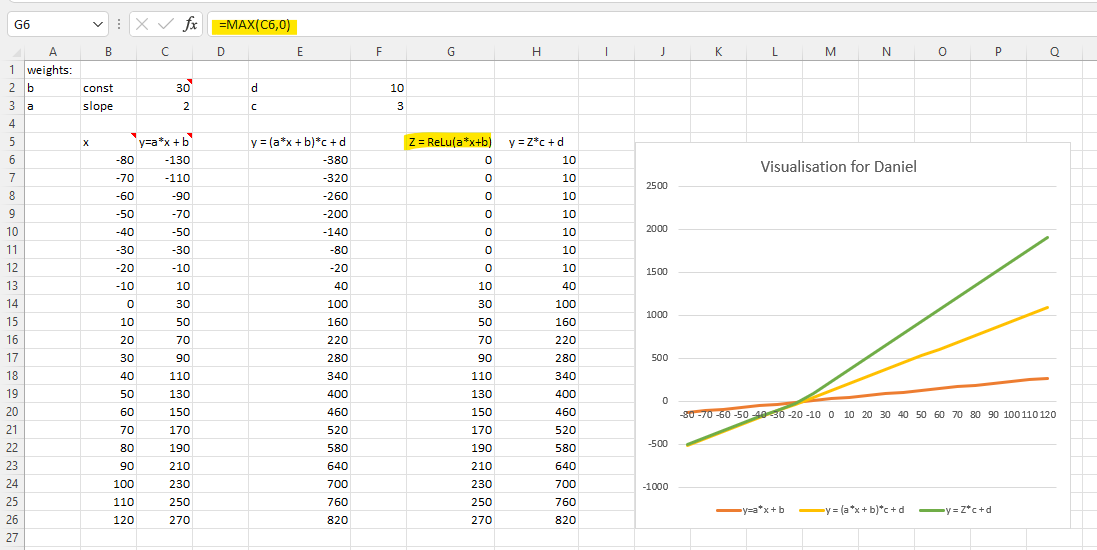
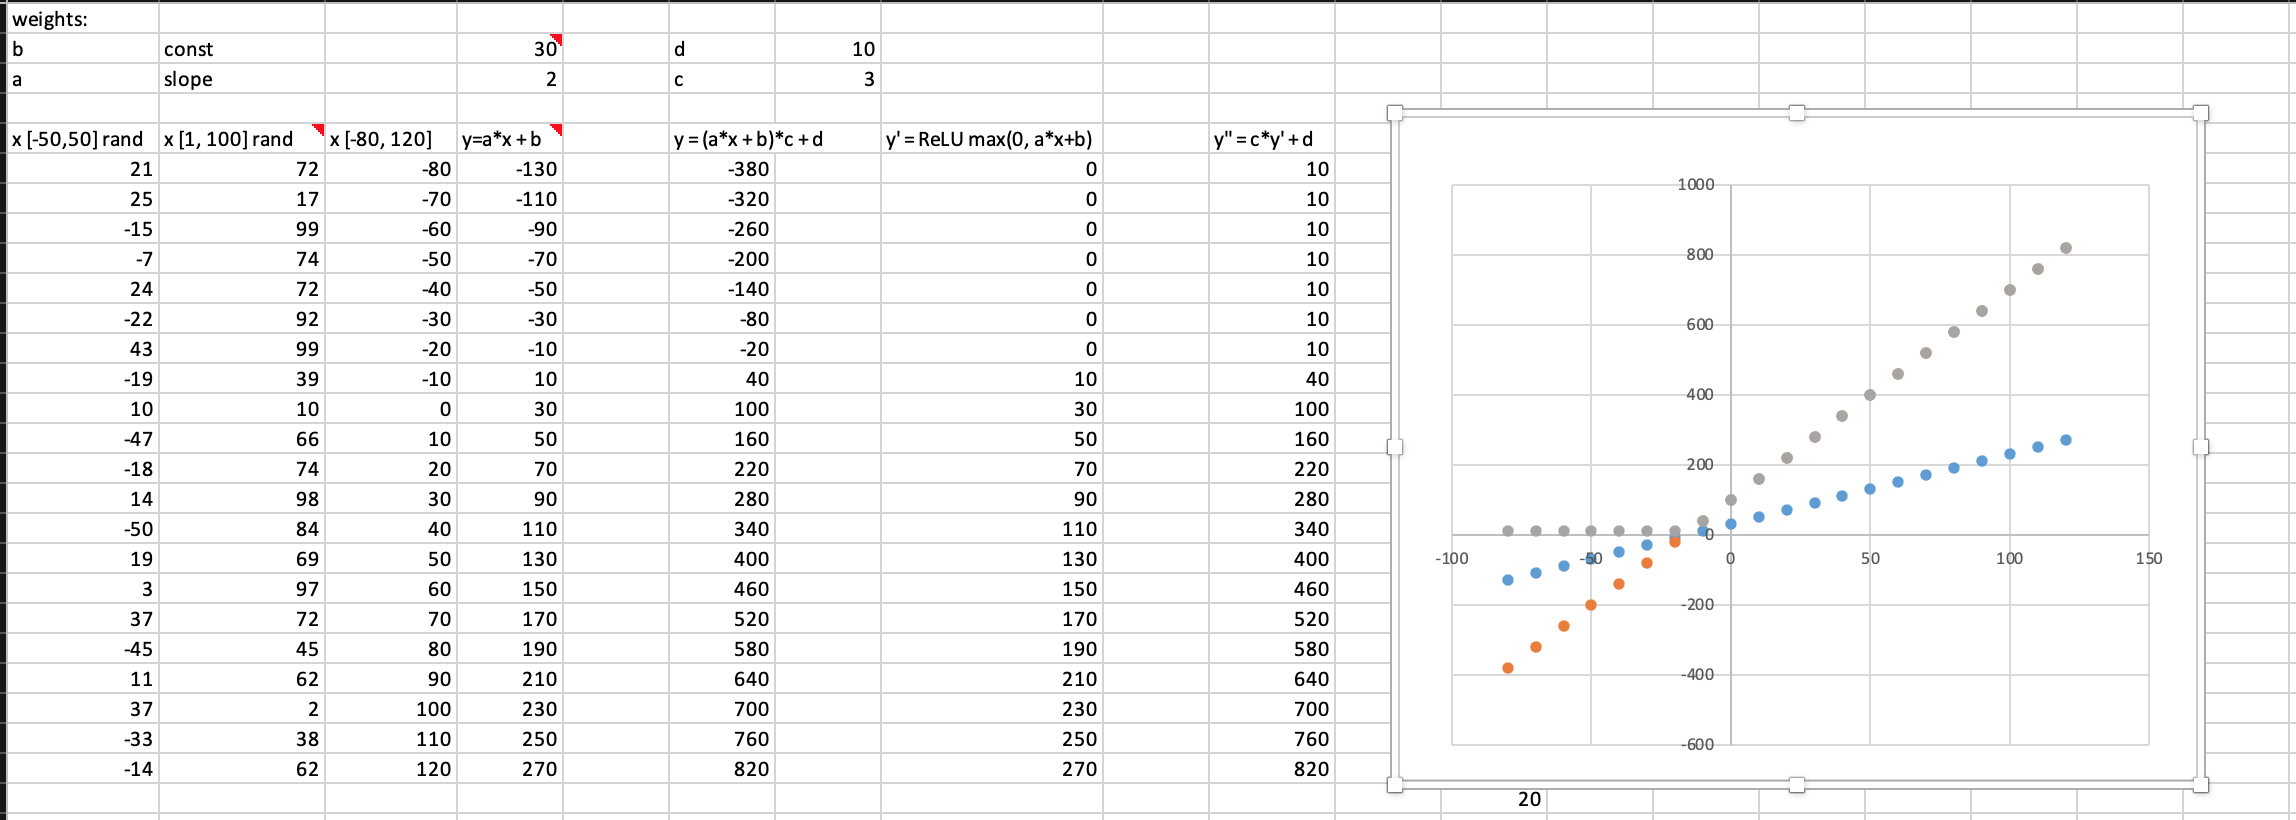
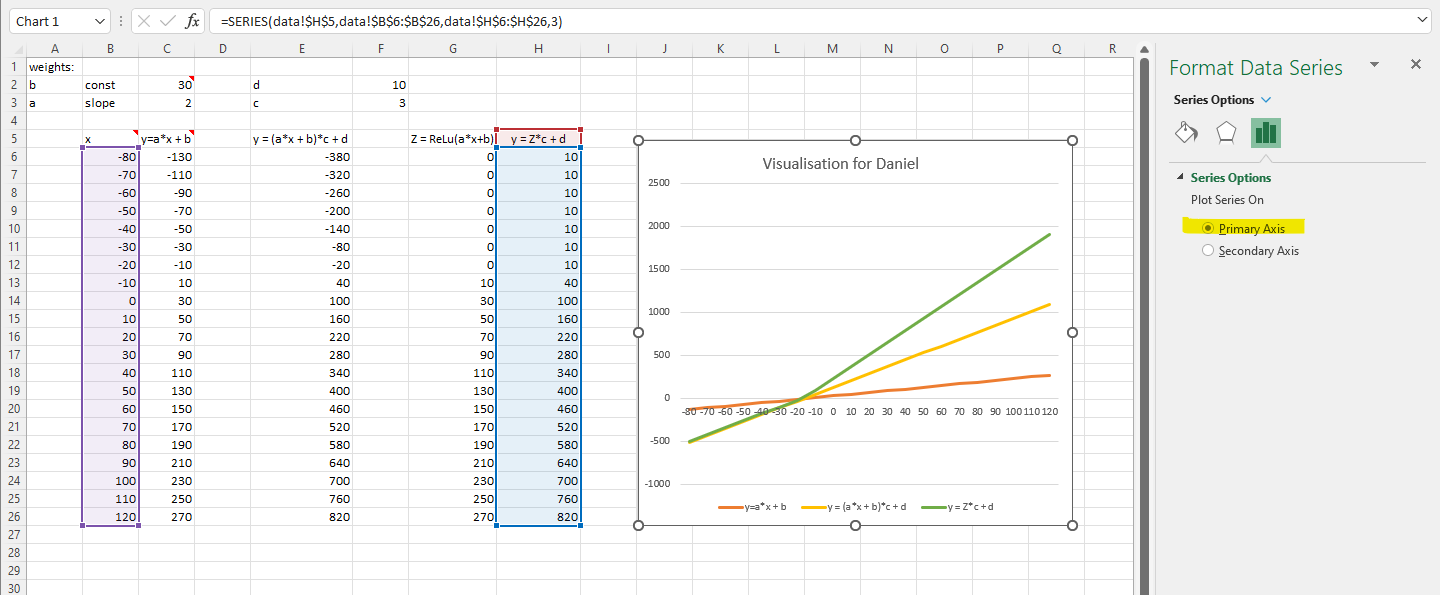
Let me try to prove it via visualisation. Let Z as ReLu of a*x+b. In Excel, that is max(a*x+b, 0) or cell C6 in the example below. So, y = c*(ax+b)+d is a bigger linear function with “a bended elbow”. With ReLu, the formula should be: y = c*[max(a*x+b, 0)] + d
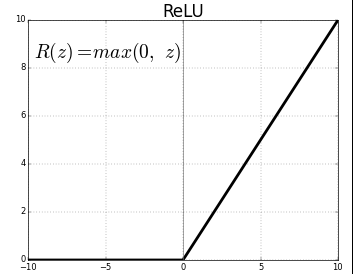
ReLu looks like below (with a 45-degree upward straight line when x is greater than zero). So, constants (a, b, c and d) impacts the slops (two different slops applied when x is greater than zero and x is less than zero) and intersections.
Does that make sense to you? Can you “see” the power of visualisation? That is how I learned and did all the experiments. ![]()
3 Likes
I heard somewhere (maybe in one of Jeremy’s previous lectures) that if we don’t have a non-linearity at each layer , the result would be as if we had just one layer. I can’t remember where I heard that.
A neural network is an Affine-ReLU sandwich and you need the delicious ReLU “filling” in between the slices of Affine “bread” ![]()
![]()
2 Likes
Thanks for the reply, Mike. You are absolutely right! The experiments I explored in the excel also confirm that models with ReLU makes training easier than without.
I will share more of the excel experiments later.
1 Like
In fact, based on my experiments, having two neurons (4 weights) without ReLU perform worse than a single neuron model, when the target function is a simple linear function with 2 weights.
1 Like
Thank you Sarada! As you have proved it with the data and graph, using ReLU the linear function becomes non-linear. In other words, with a ReLU between two neurons (a sandwich, as Mike reminded me of Jeremy’s analogy), a 2-neuron model becomes non-linear (meaning not a straight line anymore) therefore, a collapse won’t happen.
I haven’t figure out how to do graph as nicely as yours, but I did replicate the same data and a graph which however is different from yours. Please correct me if my graph is wrong.
1 Like
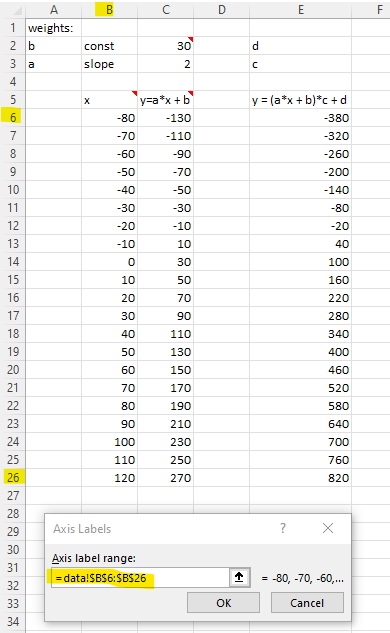
The difference is I set the x value between -80 to 120 with a step of 10. So, I can draw a line chart easily.
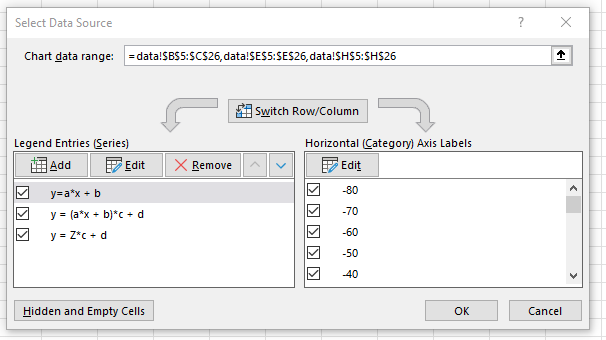
You used random numbers to generate x. Because Excel can treat each row as a data point. So, the chart may not the true reflection of the data. Check your "Horizontal (Category) Axis Labels, the setting should link to the cells for x value (not hard code value generated by Excel). I pushed my file to your repo. So, you can inspect it.
Excel tips: Highlight data and then select a chart type. Delete those columns you don’t want in the chart.

3 Likes
Now I have a more clear view of what I tried to experiment.
First of all, Jeremy used graddesc.xlsx file to demonstrate the following things for us:
- how are weights updated using SGD?
- how better techniques like Momentum, Adam etc can speed up the training with SGD?
- all these techniques can be implemented with a linear model with 2 weights.
To better appreciate Jeremy’s teaching above, I want to do the same above with a slightly more complex model. To be more specific, I want to train a 2-neuron (4 weights) model or a model of two linear functions (one on top of the other) to find the simple linear function y = 2x + 30. In Jeremy’s spreadsheet, he used a linear model y = ax+b to find y=2x+30. So, my model is slightly more complex.
Is my model smarter and faster than a simple linear model?
At first, I expected my model to be smarter may even be faster as it is slightly more complex. However, it’s error exploded without finishing one epch of training, not mentioning it is so much worse than the 1-neuron model by Jeremy.

Jeremy’s 1-neuron model has error of 151 after 1 epoch
Question: Why and how do my errors get exploded? I have not get my mind around on this. I guess I need to find a way to visualize it.
Can I get the training easier for my model by giving it better initial weights?
By giving a better weights initialization, yes, I can only finish 1 epoch and then exploding errors. The error is better but still much worse than 1-neuron model.
What if adding a single ReLU to the first neuron of my 2-neuron model?
My model can keep training without exploding errors. But my error is still much greater than 1-neuron model.
Here, I’d like to propose some interesting findings below. The updated spreadsheet can be downloaded here
When training to find a simple linear function y = 2x + 30:
- 2-neurons without activation or ReLU is not simply collapsed into a single neuron, because it can hardly train and when it finishes an epoch, the error is much much worse than a single neuron model.
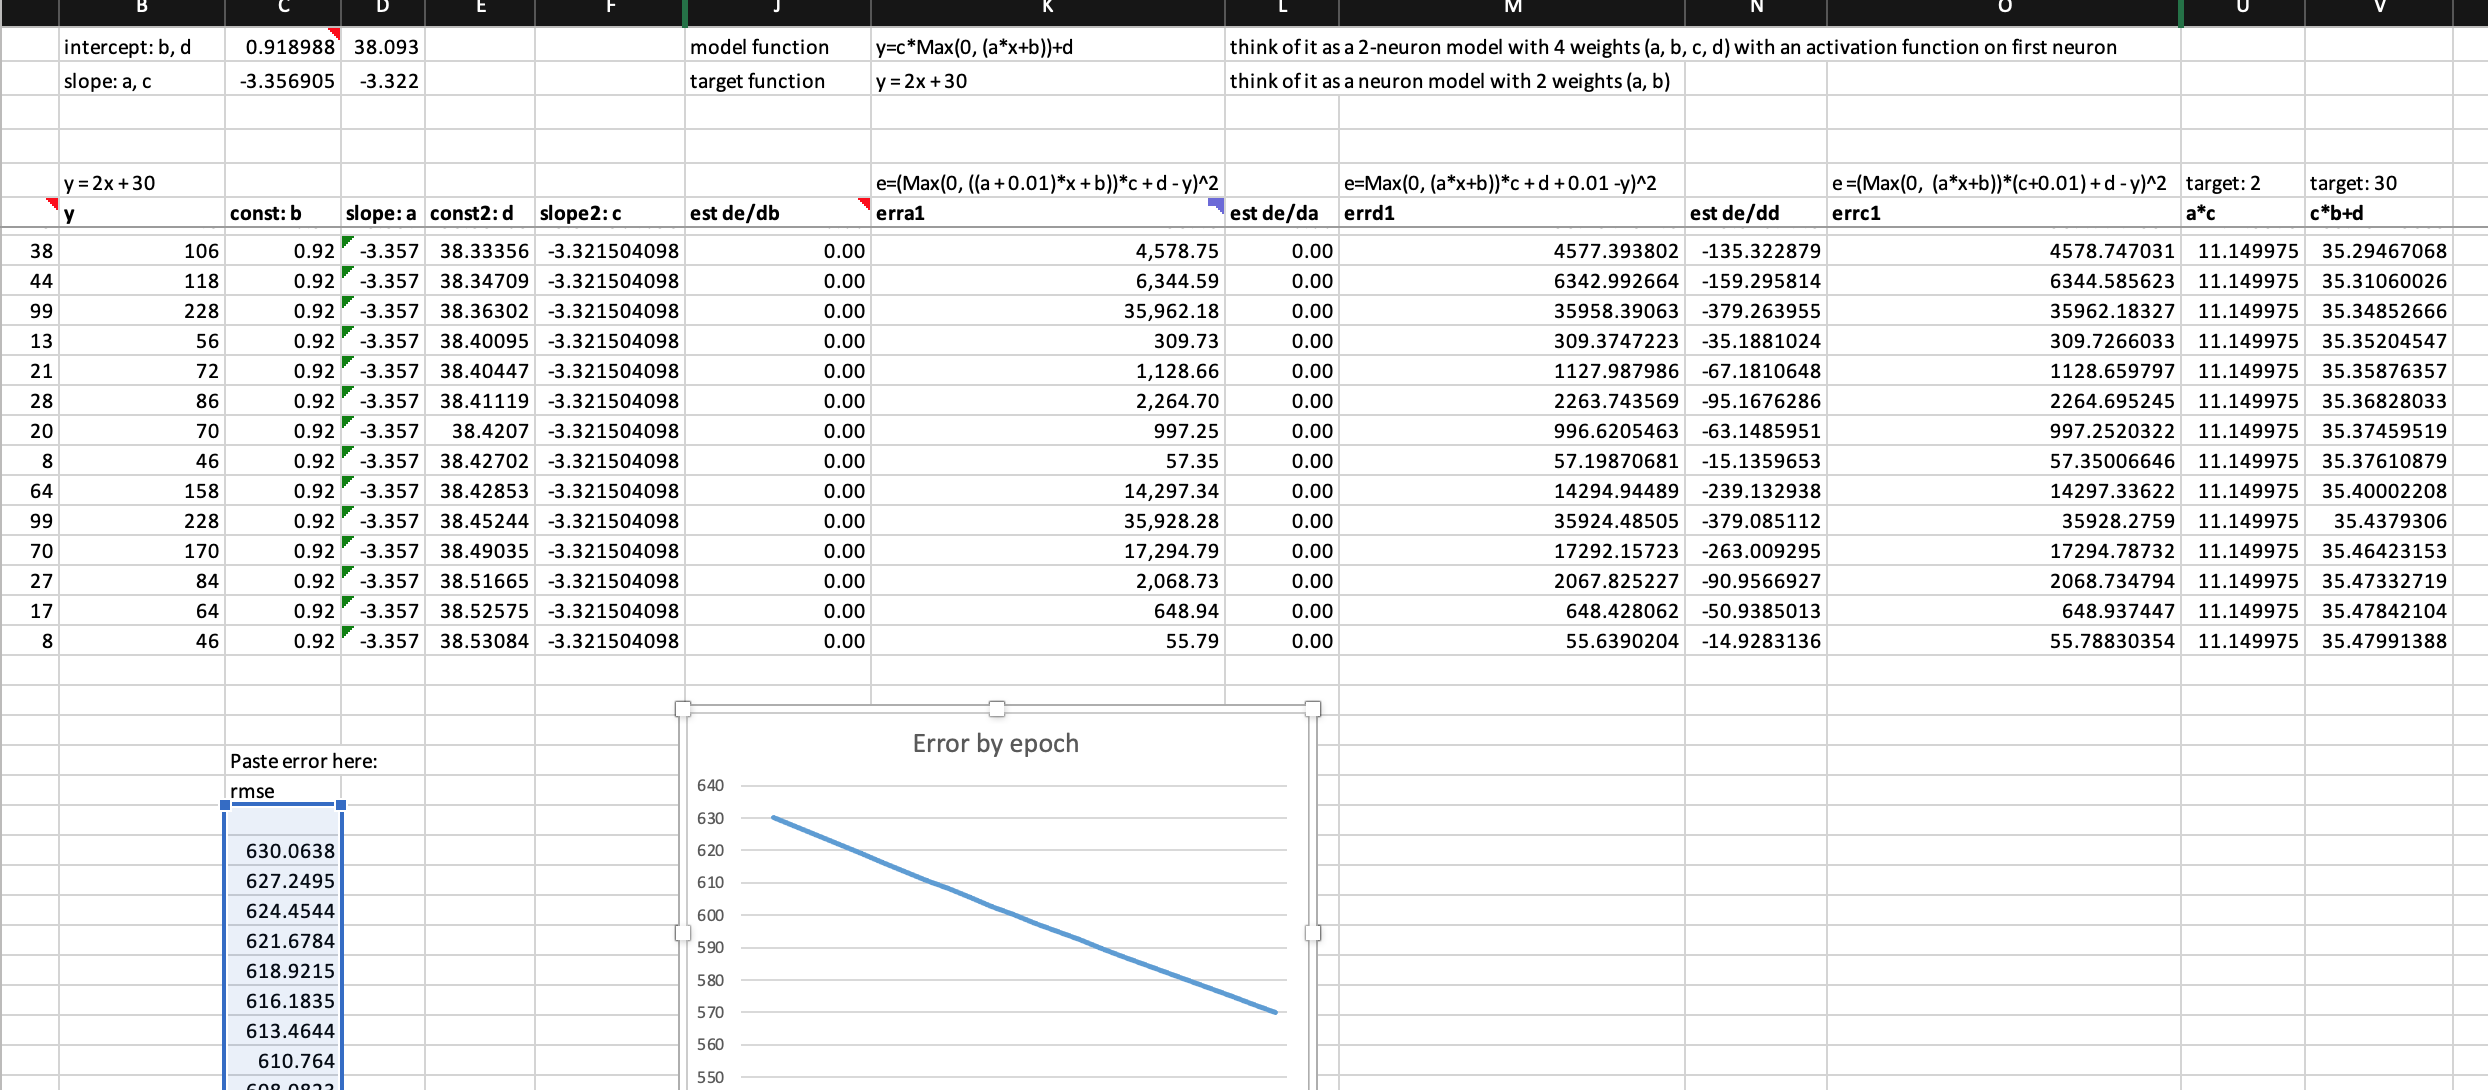
- 2-neurons model with ReLU can train freely, so ReLu makes multi-neuron models working.
- but this 2-neurons with ReLU still train much slower than 1-neuron model
Those findings above are interesting, because I can’t explain why exactly. To find out why, I plan to try to visualize the experiment data to get a feel about how error get exploded, and read fastbook chap 4 and other related chapters.
Any advice on how should I explore and experiment on those questions above are very very welcome.
2 Likes
Hi Sarada, thanks a lot for Excel chart tips. They are very helpful, and now I can create similar graphs like yours.
However, using your dataset in the excel file you made for me, I still can’t reproduce the exact graph you did. (I tried to adjust the y-axis range to your exactly like yours. I also inspected the data columns you used for plotting the graph, everything is the same when I made the two graphs on the same worksheet.)
But as you can see in the image below, on your graph the data plotted seem not right (there is no data points greater than 1000 or less than -400). But when I inspect your dataset in your graph, all data selected are the same to mine. I simply can’t reproduce your graph ![]()

2 Likes
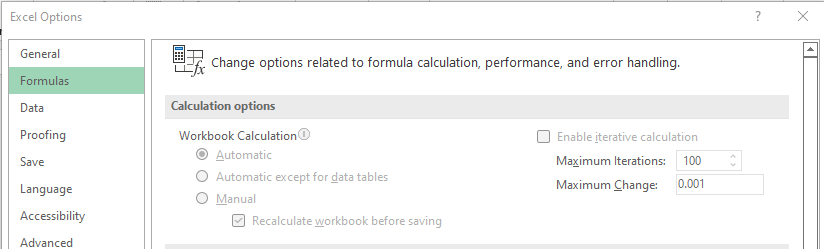
Hi @Daniel Thank for pointing it out. It seems the problem is at my end. I set the workbook calculation as “Automatic” so I did not check the y-axis values. My bad.
For some reasons, the auto/manual calculation options are grey out.
Interestingly, the same dataset (green line) changed values if I switched from Primary Axis to Secondary Axis (with the corrected y-axis value shown at the right-hand side). I think there is a ![]() .
. ![]()

3 Likes
Thanks Sarada and Daniel, am coming back to follow all above in detail, am currently catching up on videos, been away for a fortnight.
2 Likes
Investigation Question
What happens to a 2-neuron model when you give it a ReLU?
Investigation part 1
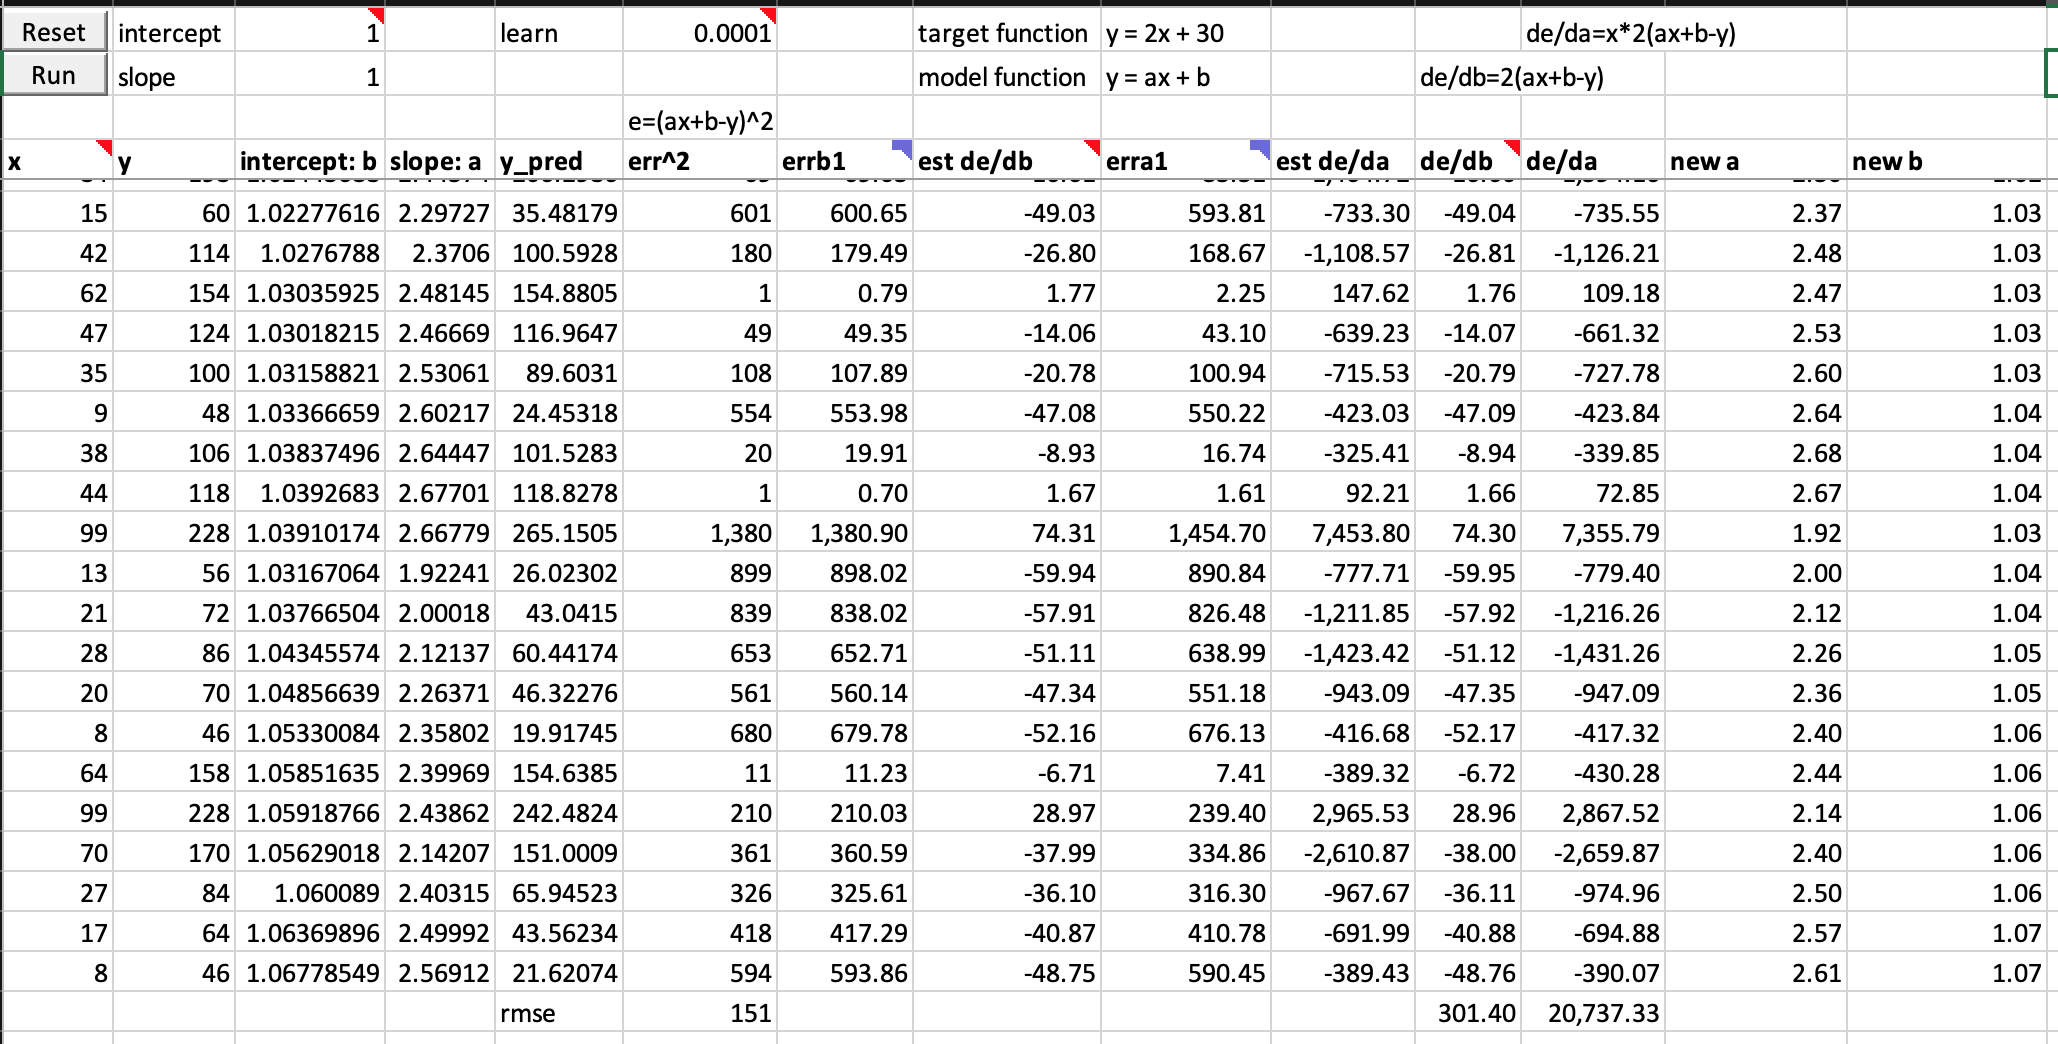
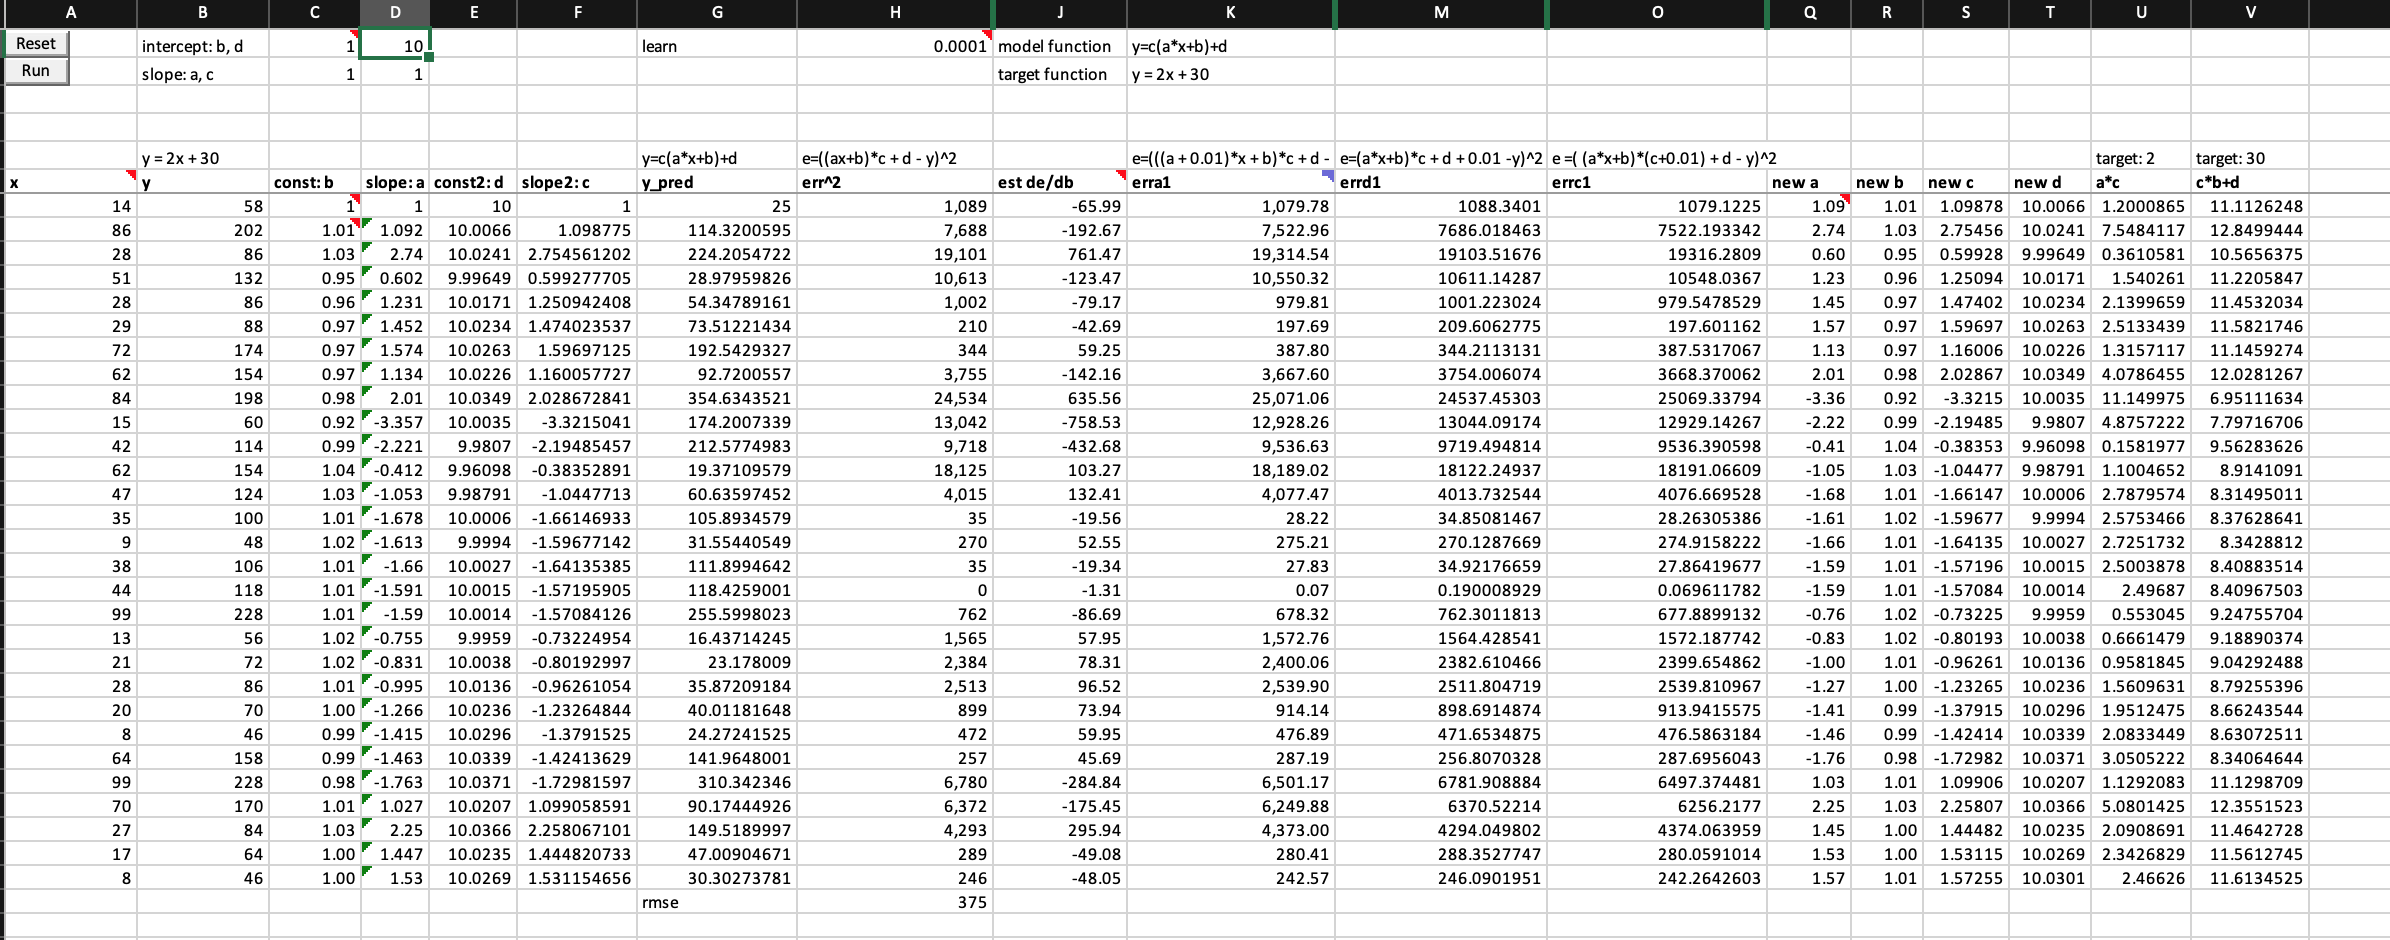
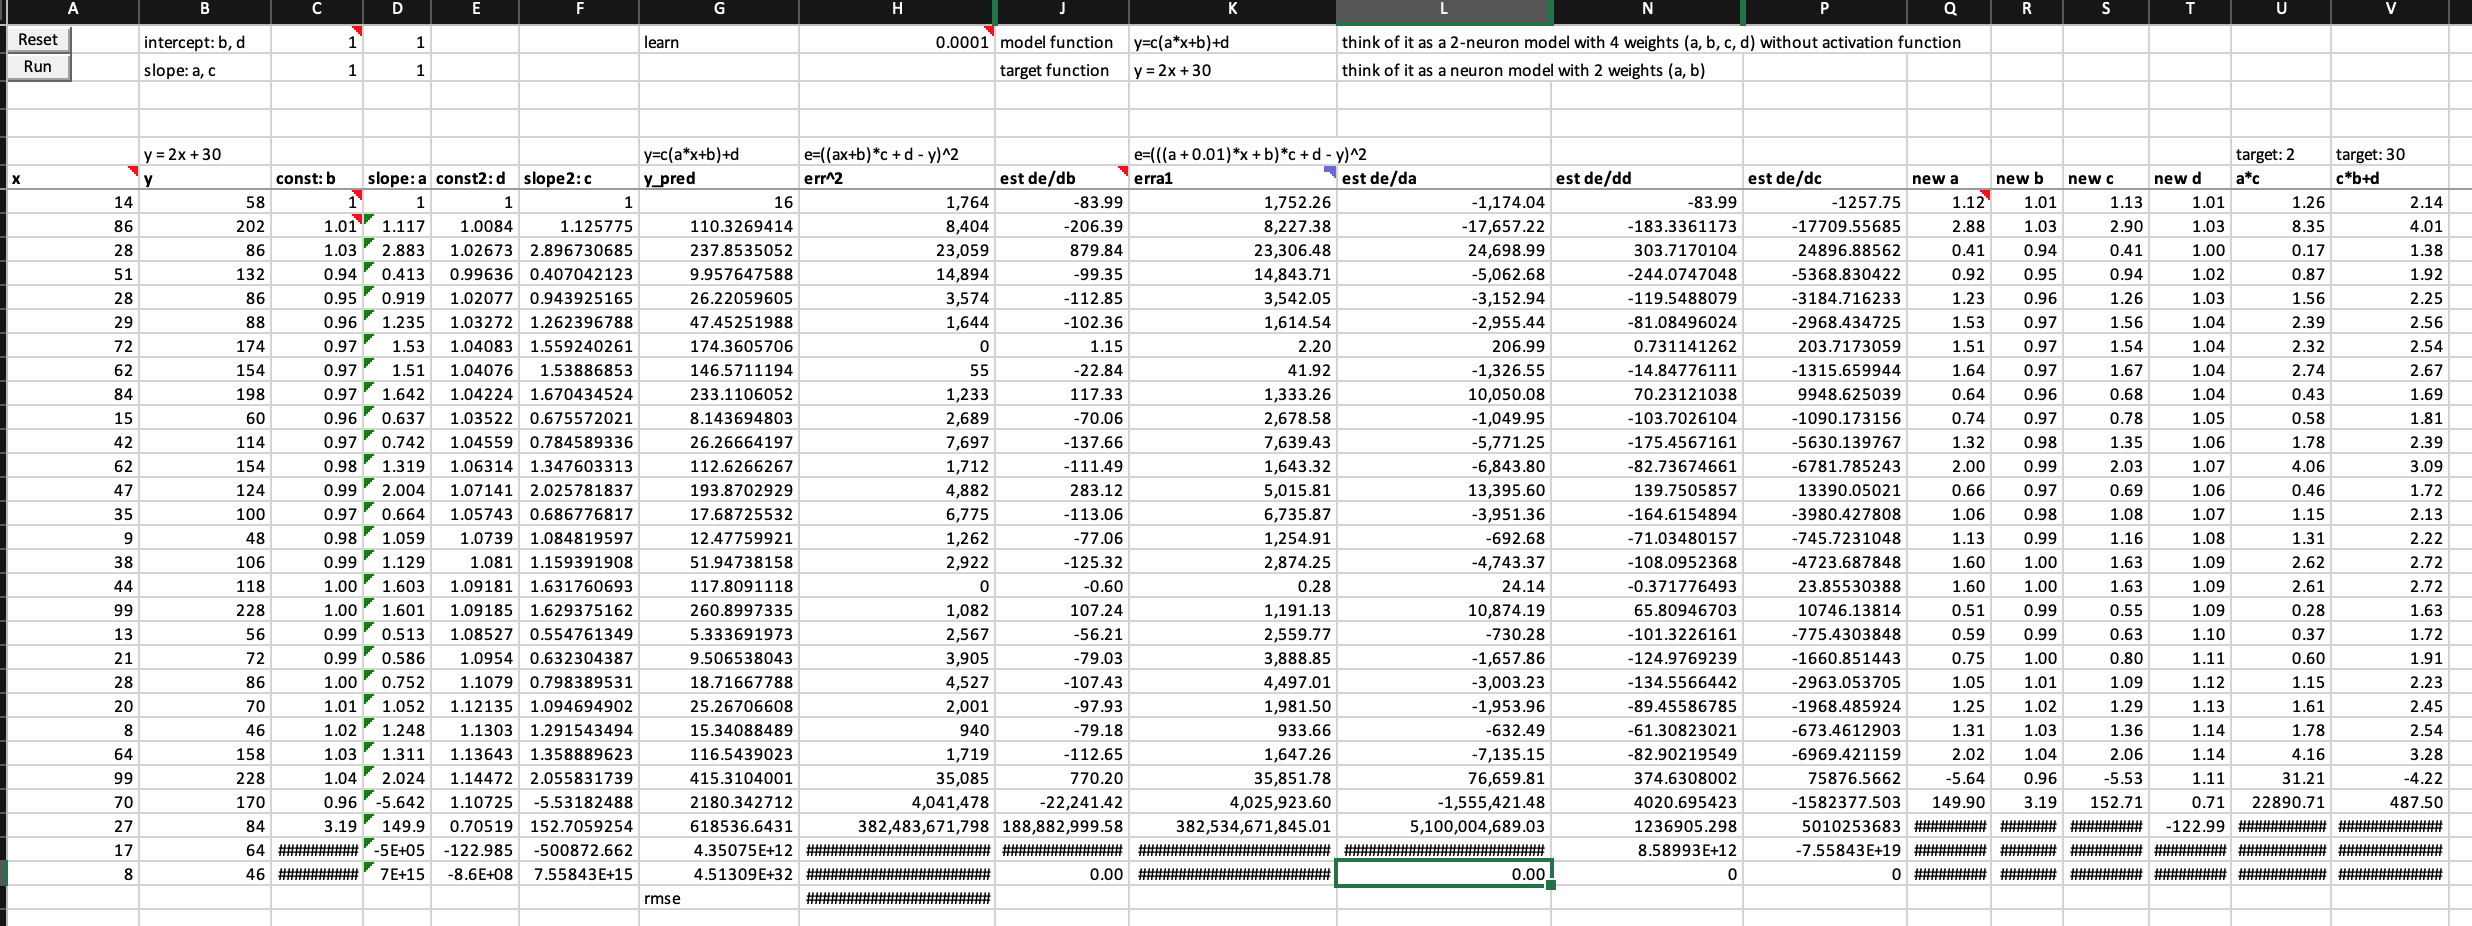
What happens when you train a 2-neuron model with 4 weights to find a simple linear function y = 2x + 30?
Summary
- The model can’t finish training the first epoch
- The error value is exploding near the end of the epoch
- So do the values of all weight and their derivatives with respect to error
Experimental data
Investigation Part 2
Why do errors, weights and derivatives all go exploding? Given SGD using derivatives to tell the model which direction should weights go and by how much, why would weights and errors go crazy?
yes, derivatives of weight to error do tell us which direction to go in order to decrease error, and also tell us if the weight goes up by 0.01 how much lower would error go. However, neither you nor the derivative tell you how far your weight is from the optimal value for error to be minimum.
So, when you calculate how big a step your weight is taking, SGD says besides using derivatives and you should put a knob (i.e., learning rate) to adjust the weight step manually, which is very clever.
Your model won’t train without an appropriate learning rate
Setting an appropriate learning rate is very important to ensure we can start training without exploding, because you could image the first step of your weight can be so large that your weight can’t move closer to the optimal value and error can’t go down. See what happens to the model when setting learning rate from 0.0001 to 0.01 below
Experimental data
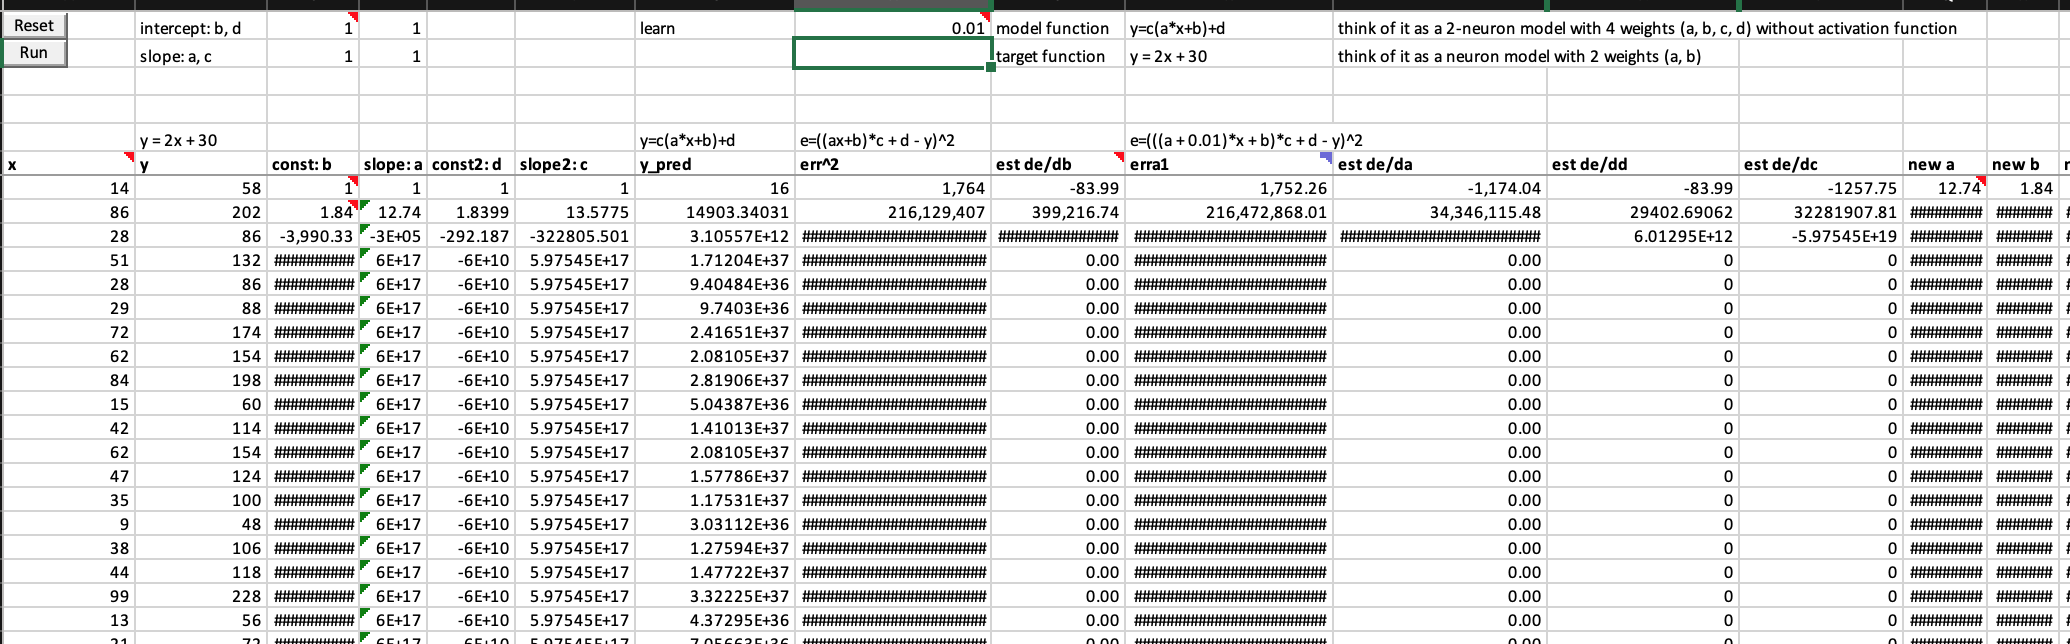
So, having an appropriate learning rate at least for the starting section of the dataset is crucial to keep training going, meaning weights can move in good steps toward optimal weight values and error is decreasing.
Derivatives of changing weights seem unpredictable, how SGD using learning rate to manage weights toward optimal in most cases?
However, one shoe size can’t fit all feet. You can’t guarantee the next derivative value is always smaller than the previous one. In fact, sometimes, the derivatives can go much larger than the previous derivatives. As long as the derivatives are not too large, and the step size is still appropriate, given the correct moving direction provided by derivatives, so the weights can still move towards the optimal regardless how fast or slow.
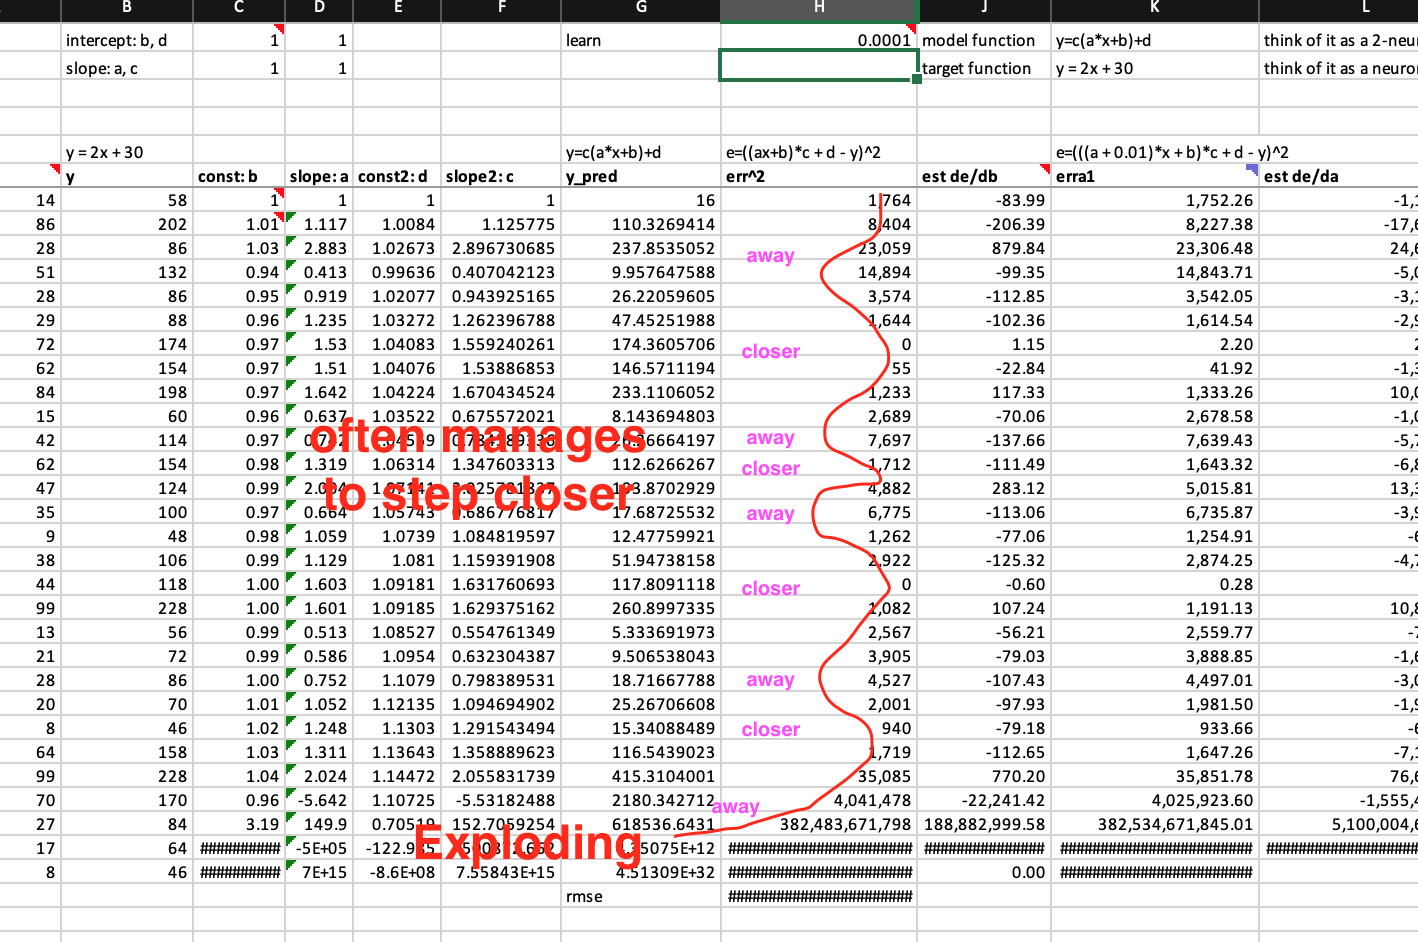
How derivatives and errors go exploding under SGD’s reign?
However, in some cases the derivatives can be so large that the learning rate is no longer appropriate, and the step the weight makes is a big step away from the optimal even though the direction provided by the derivative is correct. And the derivative at the new point may well even be larger, and therefore the weight will even further away. It could become a self-reinforcing loop to move further and further away from the optimal. No chance to bring them down anymore. So, derivatives and error all go exploding. (see the graph above)
This is today’s investigation and speculation. If you find anything suspicious or wrong, please share with me, thanks ![]()
2 Likes
Hi @jeremy, if I keep posting about fastai and excel in this thread (Live coding 16), will you eventually split it into a different thread (e.g., exploring fastai with excel)?
If so, will all the links of the splitted posts be changed? Since I am documenting every knowledge point (using post links) I learnt with @Moody and others on this topic, I care very much whether the links will become unusable after the split.
If they change, I hope you (assuming you are the only one can do it) don’t split the relevant part of this thread so that we can keep the links unchanged. Maybe I can start a new thread to do fastai exploring with excel? What’s your suggestion on this?
Thank you!
2 Likes
I wasn’t planning to split it out, but even if I did I don’t see any reason that it would break outgoing links.
2 Likes
Hi @Daniel, After studying on the Excel version about the impact on learning rates, it is time to learn deeper. Check out fastai docs and blog. ![]()
2 Likes
Thanks a lot Sarada for the guidance and support! I surely love to explore the resources you pointed out some time later.
To be honest, I just start to feel a little more comfortable working with Excel on the 2-neuron model of mine. I would like to stay in the comfort zone a little longer ![]() . I would like to thoroughly go through all of Jeremy’s spreadsheets first which are also directly related to the part 1 lectures. What do you think? because to me, they are all very exciting and new worlds to be discovered and experimented.
. I would like to thoroughly go through all of Jeremy’s spreadsheets first which are also directly related to the part 1 lectures. What do you think? because to me, they are all very exciting and new worlds to be discovered and experimented.
please be more patient with my progress ![]()
1 Like
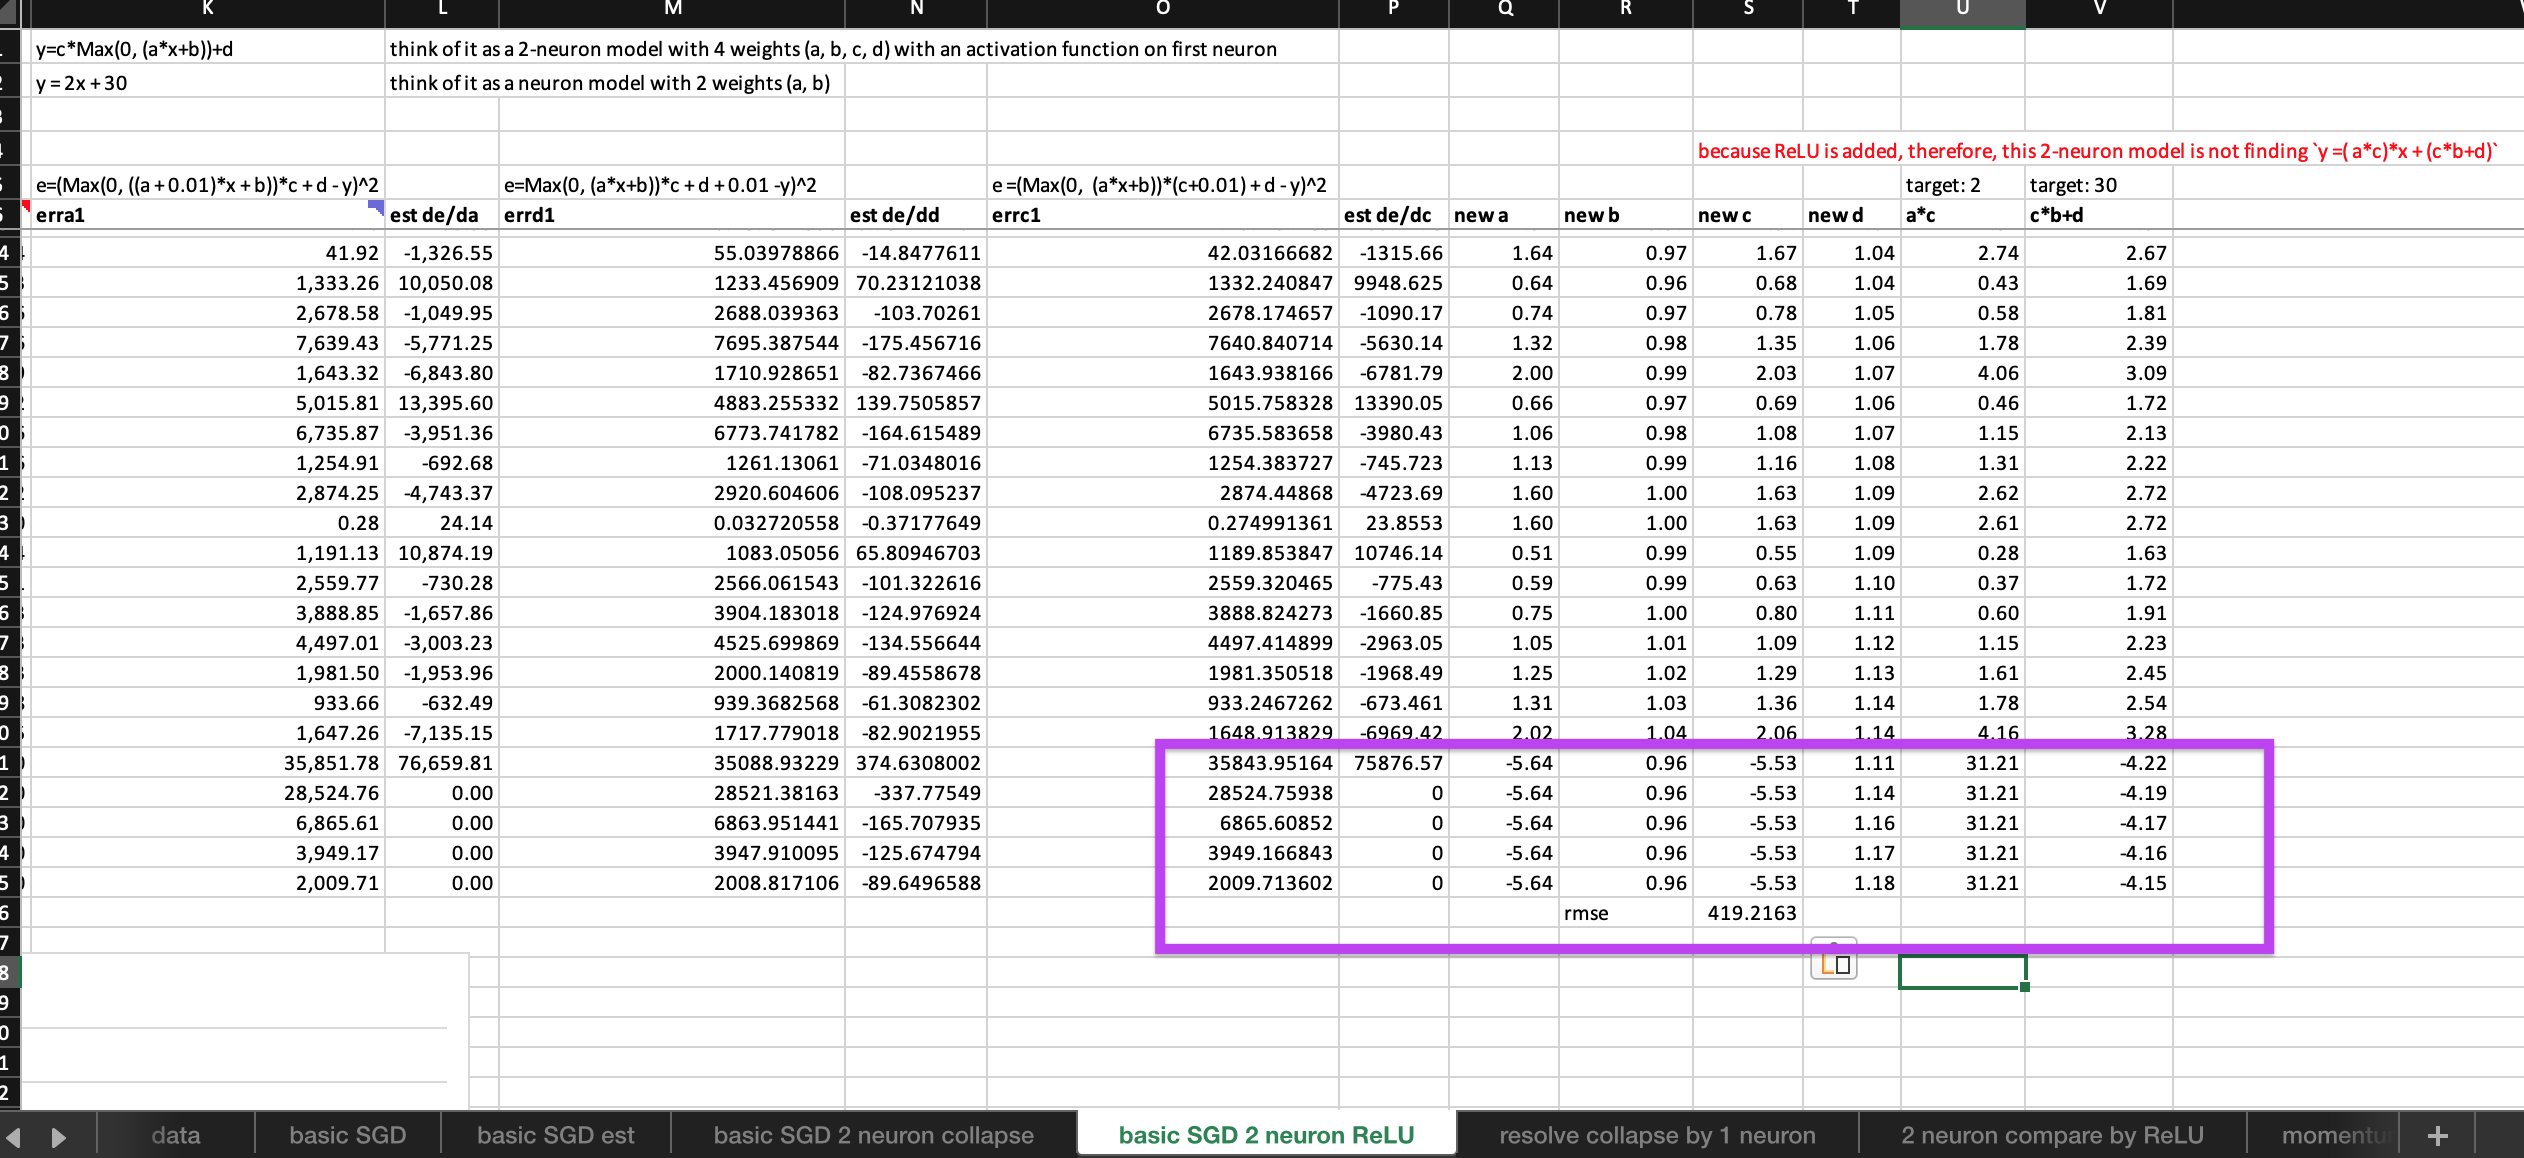
Yes, so, can we propose that the non-linear activation is the key to turning the ordinary linear layers/neurons into magical neuralnet? Is it true? I think the excel experiment below provide some support to this proposal. @Moody
The observations from the experiment:
- after adding a ReLU to the first neuron, the 2-neuron model can train freely without error exploding (it must have been magic of ReLU, right?)
- within the first epoch, 3 out of 4 weights found their optimal and stop updating themselves (Whereas, neither of the two weights of 1-neuron model’s are still updating without settling, it must have been magic of ReLU, right?)
- however, although improve steadily the error is far worse than the 1-neuron model. (Interesting!)
try the spreadsheet yourself
Then comes more questions:
- Why a more complex and smart model (4 neurons with ReLU) still can’t beat a single neuron model without activation function?
- Can such 2-neuron ReLU sandwich ever beat a simple linear neuron model on finding this simple
y=2x+30target? What can we do about it to achieve it?
1 Like
I read somewhere that if you don’t have non linearities in between, then it’s as if you’re just doing logistic regression. I wish I remembered which lecture it was.
1 Like