Let me try to prove it via visualisation. Let Z as ReLu of a*x+b. In Excel, that is max(a*x+b, 0) or cell C6 in the example below. So, y = c*(ax+b)+d is a bigger linear function with “a bended elbow”. With ReLu, the formula should be: y = c*[max(a*x+b, 0)] + d
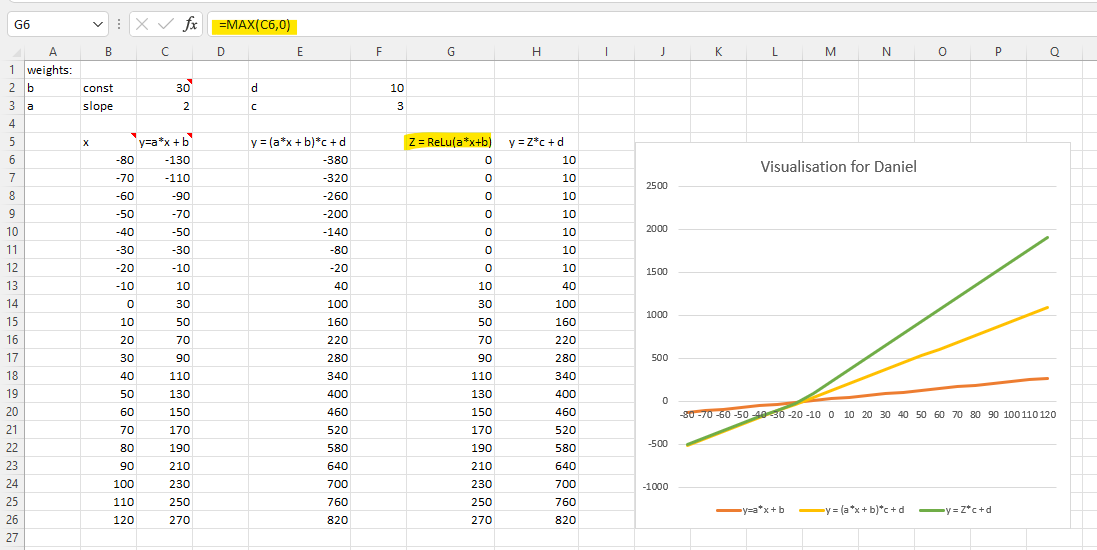
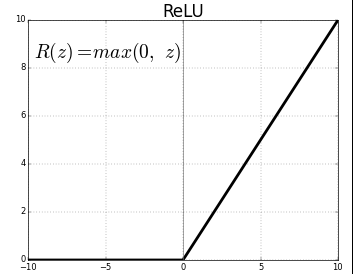
ReLu looks like below (with a 45-degree upward straight line when x is greater than zero). So, constants (a, b, c and d) impacts the slops (two different slops applied when x is greater than zero and x is less than zero) and intersections.
Does that make sense to you? Can you “see” the power of visualisation? That is how I learned and did all the experiments. ![]()