Thanks!
It all falls into place now.
It’s quite strange but interesting that despite forming everything correctly, it all boiled down to the loss function and the log did the trick.
Of course, the log made it easier for the computer to handle computations with very large or very small numbers.
Too many learnings in this chapter. I was thinking that I would be done in a day or two but it has taken more than a week or so and now I have started getting some grasp on what might be happening.
I was trying to understand what torch.where does (sadly the examples in the PyTorch docs don’t cover the case I was interested in). Here is a quick link, if anyone is interested - Torch.where | Musings of Learning Machine Learning
Hi all, I am training a model on a dataset with 10 classes and around 120 images for each category. I kept a tab on what changes I was making and placed it in a table.
As I was changing the parameters and changing the pre-trained models, it felt like I was randomly doing this and that.
Is there a better approach to training and seeing improvements? Any pointers will be appreciated.
Hi I am doing a perhaps more basic thing but wanted to get more into terms with the inner workings of deep learning.
Following the Excel example that Jeremy is showing, I am trying to see a bit the inner workings of Neural Networks. So I added in the Sheet, a third line of parameters, ReLU3, updated the loss function and ran the solver. The loss was reduced to 0.131.
My queston is: By adding yet another set of parameters and one more ReLU computation, does this correspond to having two intermediate layers, before the output is produced? I got the impression that the NN internally could look like:
where by dot above, I mean “dot product”. Does this approach the way it works, at all? Is it perhaps a new “epoch”, when we add some new parameters, or is the system so far unaware of how to properly adapt the parameters, in order to minimize loss?
My gist tells me that we are not adapting the parameters as when we were doing abc -= abc.grad*0.01, but wanted to cross-check .
I am facing the same issue when predicting the model locally.
"AttributeError: ‘GELU’ object has no attribute ‘approximate’ "
Have you found any solution for this?
Thank you for this! I was very confused why the results wouldn’t converge towards the correct values even if I tried increasing steps or changing learning rate.
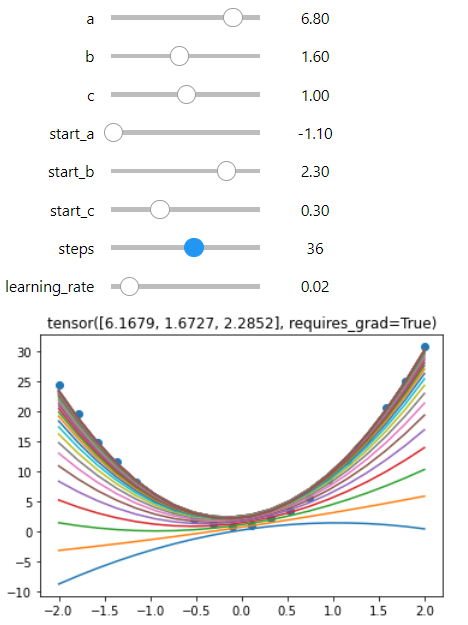
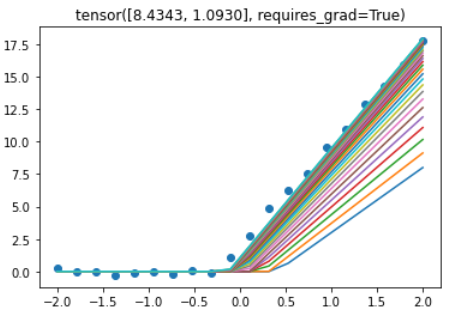
I have packaged the gradient descent code into a single re-usable function, and tested it with various functions.
It displays the learning process in a graph and the notebook has a lot of interactable sliders that help illustrate how the parameters work.
It might be helpful to other students. NOTE though, I am a complete python and AI noob. So please forgive me if there is anything strange or nonstandard.
Hi - I watched the video first and now I am trying to go execute the notebooks used by Jeremy in the video. However I am unable to find the exact notebook used in the video for Gradio pets classifier. The hugging spaces pets classifier code seems different to the one in the video and I’ve spent hours reading through the forum and I am still stuck. Could one of you please point me to the right place?
Thanks Jeremy. I went through the links but I couldn’t find the code that you used in your video around the 8 min mark - pets breed detector. So I wanted to ensure I wasn’t missing something.
I have gone through the whole video course multiple times and now I am going through the whole textbook. I am on chapter 6 and I noticed this formula concerning Binary Cross Entropy used for handling the loss of multi-label classification
My question is in the case of log 0, which is -inf, how do we handle such a case? A case where the target is 1 for instance and the inputs(prediction) is 0.
Is there a link to the Jupyter notebook that Jeremy is working in at the beginning of the video? The pet breed model to be exact. He posted a link to the hugging face space, but isn’t it better for us to run it as a notebook?
Hey @scotty529, The hugging face space link at the top takes you to the “Files and Versions” tab which is a repo. The notebooks are contained within the repo that you can clone/download and run wherever you want. You can’t run or view the notebooks easily in HF spaces. Alternatively maybe this is what you’re looking for:
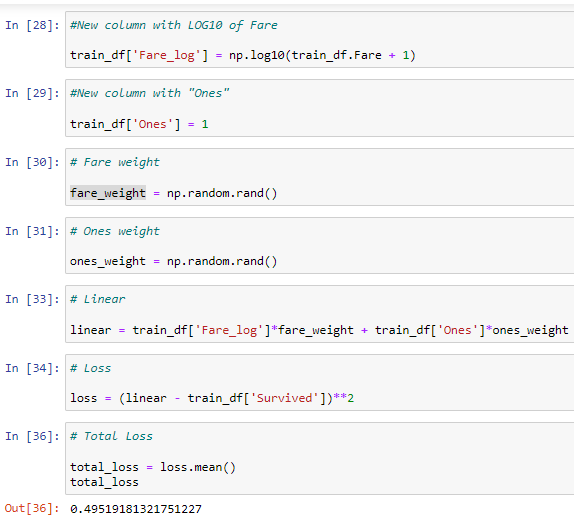
I’m trying to replicate the beautiful Excel linear regression from the video to Python.
I’ve done all the steps until that magic that Excel’s “Solver” does.
What should I do in order to write that in Python?
Thanks!
(the following example uses only “Fare” for convenience)