Lesson 2: further discussion ✅

Does anyone have experience / code for multiple ‘training-sessions’ with different parameters and getting the results mailed or saved?

I want to do multiple experiments, eg: to see the number of images is impacting the accuracy, so first training with 100, 200, 300 … 1000. Trying different ways of downloading images. Or trying multiple learning rates, sizes etc.

Running automatically through the night and reporting back to me in the morning :sunny:

Probably off topic or too early:

There are lots of competitions / benchmarks trying to improve the speed (in combination with accuracy) of machine learning models. Are there also competitions / benchmarks on trying to limit the number of training examples?

I’m impressed by results so far, but I would be more overwhelmed if we could lower the number of training examples. E.g. my 3 year old son only needs to see 2 dinosaurs to get the concept of a dinosaur and recognise them. How can we be inspired by this? Eg give some additional meta info, like text from wikipedia

‘Cats are similar in [anatomy] to the other felids, with a strong flexible body, quick reflexes, sharp teeth and retractable claws adapted to killing small prey.’

Is there any research / benchmarks in this direction?

1 Like

Hello, I hope this is the right thread to discuss the points below.

Thinking about what jeremy explained during the last lesson I had a few questions/observations to share with all of you.
1 - It seems that computing the most effective “function” means finding the function having the minimum error-rate function calculated towards all the “data-points” we have in our data-sets.
But what happens when we have a 3D (or multidimensional) space?
Is there any other relevant concept we should start considering?
Or we should calculate all possible permutations of errors functions and get their average (e.g. in a 3D-shaped InfoSpace: error function for plan XY, error function for plan XZ, error function for plan YZ)?

2 - Connected to (1), how do we manage multi-label classification in images? I mean…it’s clear to me that classifying an image is getting the value for the “top” argmax index from the computed probabilities. But what’s about having multiple labels within a single image? How do we handle that?

Thanks very much

1 Like

With regards your second question, you might like to check out the planet notebook in the v3 GitHub repo (it looks like that notebook was originally provisionally slated for lesson 2, but hey-ho).

1 Like

Thanks @AndrewK

In lesson 2, Jeremy explains that if training loss is lower than the validation loss, it does not necessarily mean overfitting as long as val_accuracy increases (or error rate decreases).

So does that mean I can train my model for as long as accuracy is increasing?

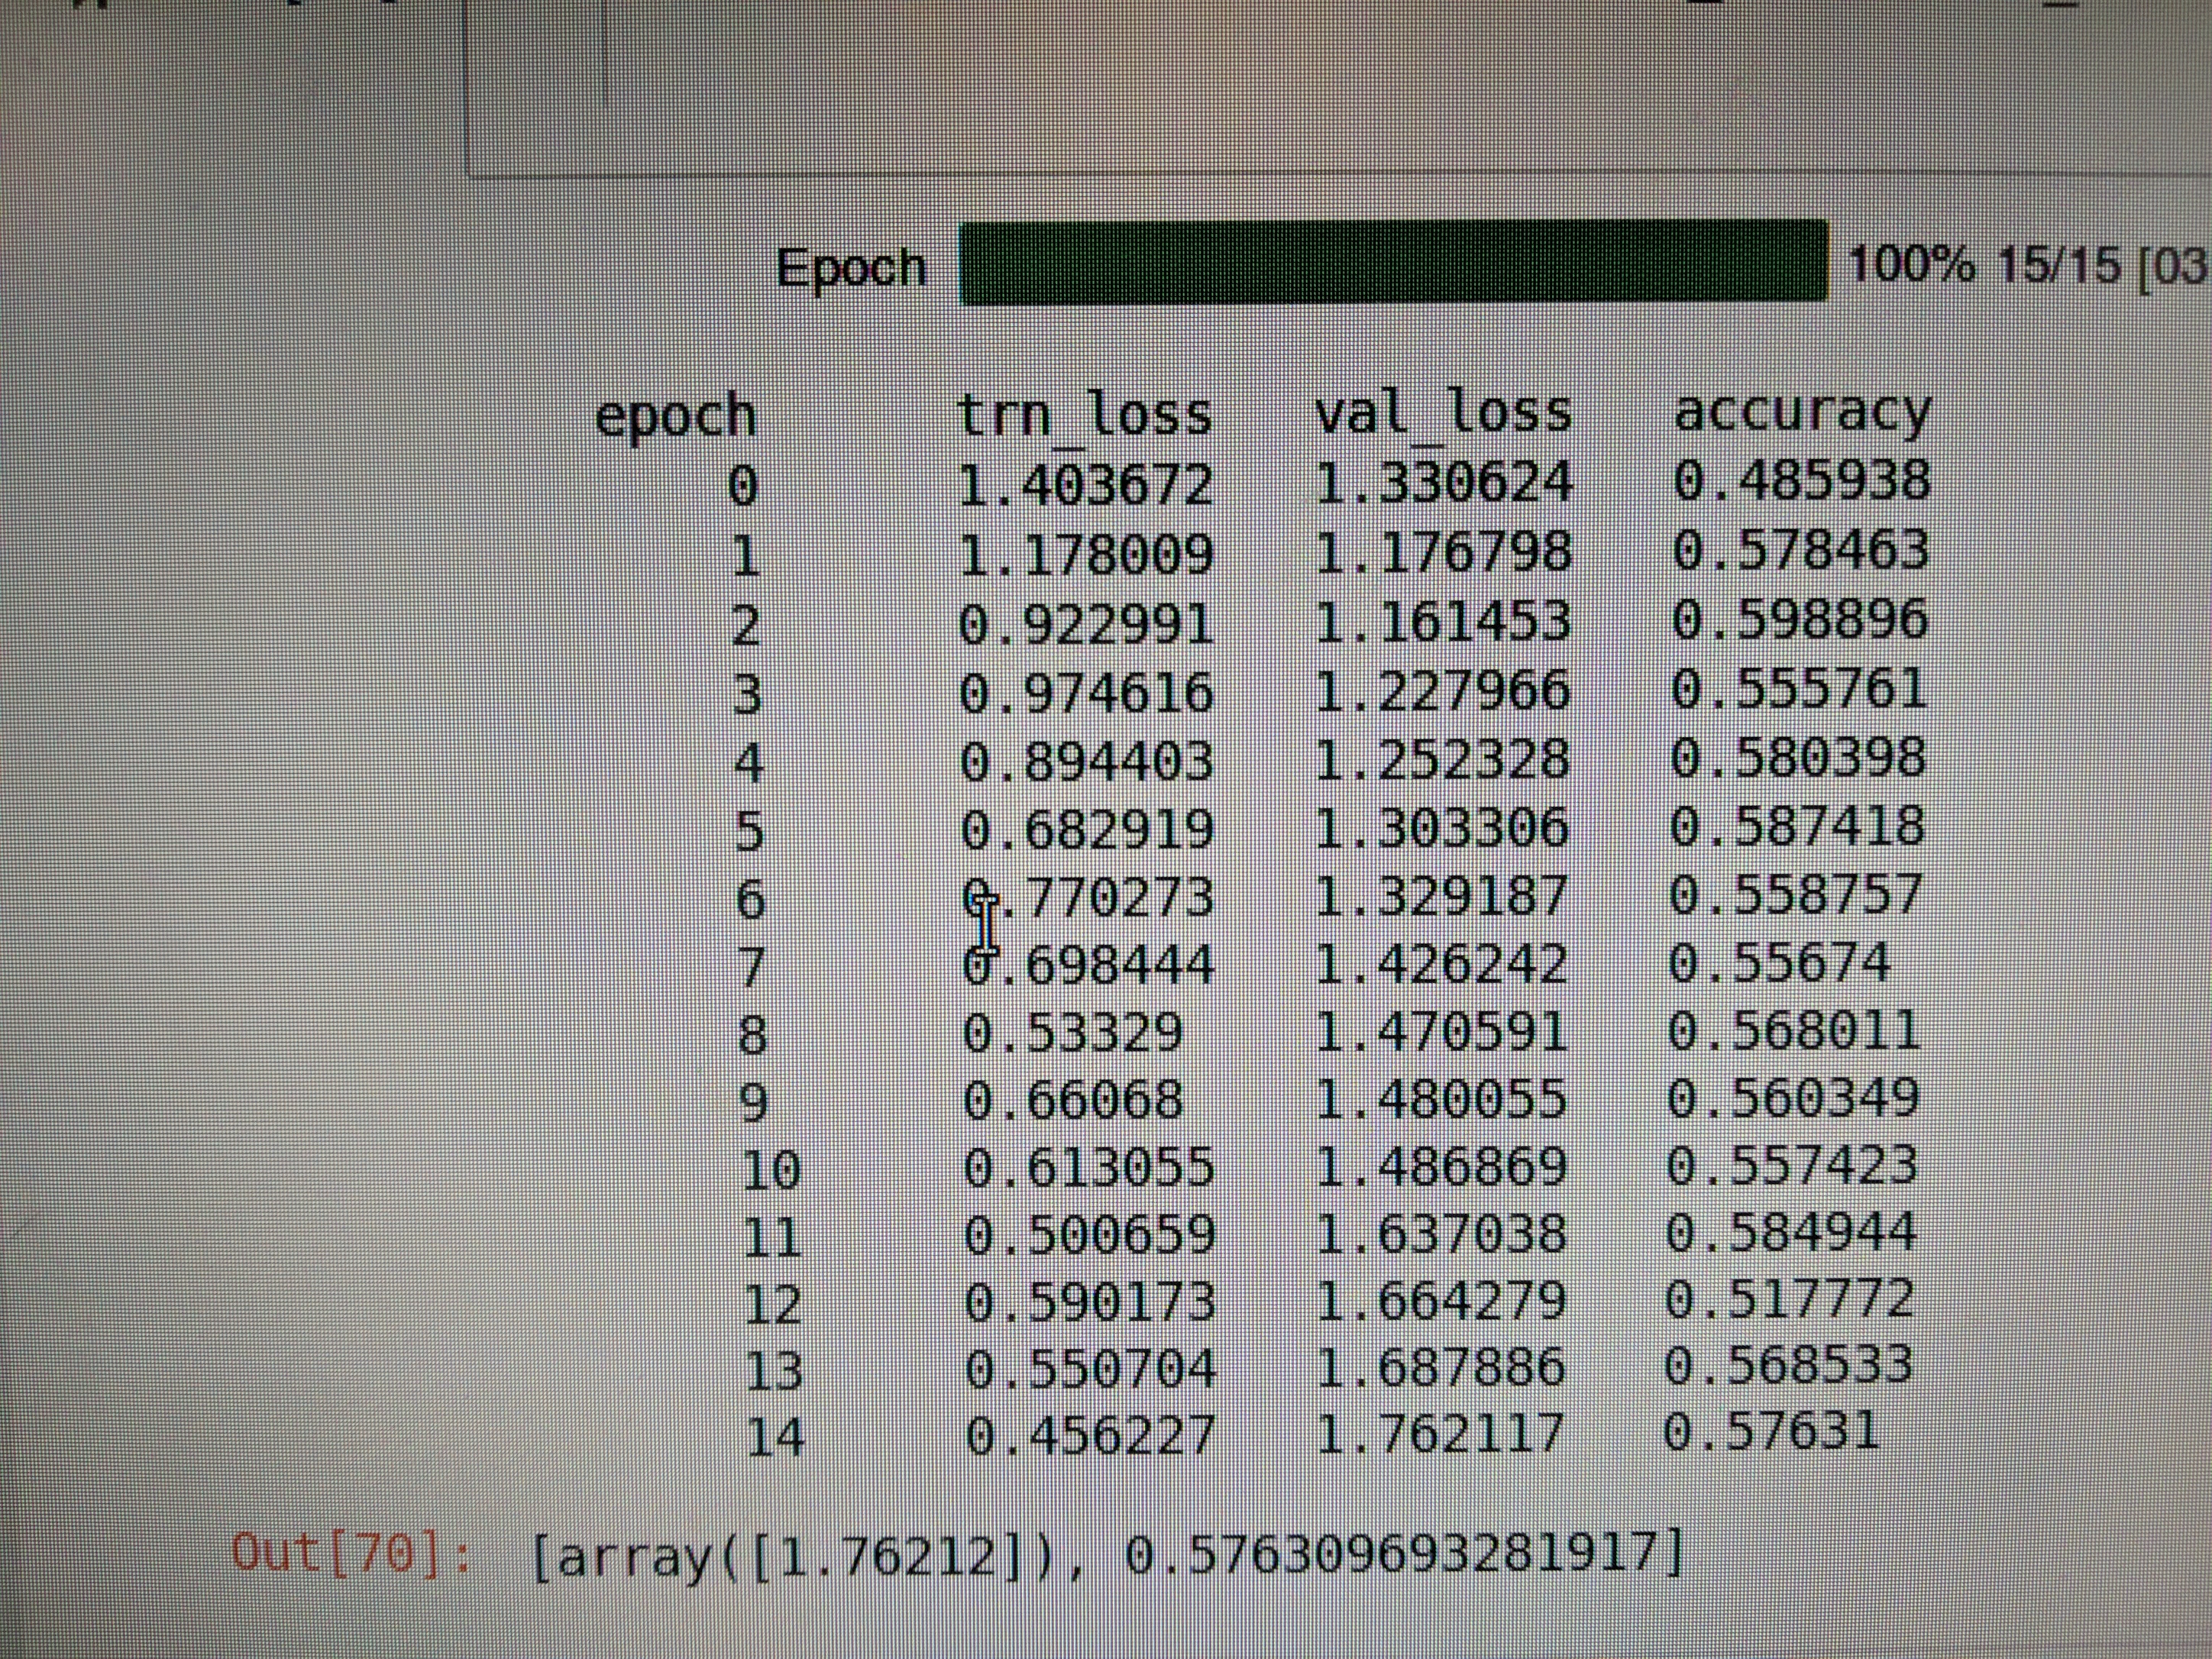
When training the model, my accuracy is increasing, training loss is way lower than validation loss, but validation loss is increasing as well. What does this signify? Am I overfitting? Or am I ok as long as accuracy is increasing?

Hey, do not at jeremy. (Unless it’s extremely critical).
He have mention it in many places (even in videos)

Hi all,

I had a few questions while I’m working through my dataset (architectural style classification):

  1. This question was posted upthread by bbrandt but I’m running into it as well - how should one interpret an upward sloping learning rate plot? There is almost no extended downward sloping region to determine a LR. Here’s my actual plot:
    lr_climb

  2. What are the probabilities returned by learner.predict (third element in the tuple)? The documentation (https://docs.fast.ai/vision.learner.html#ClassificationLearner.predict) shows a tensor that sums to 1.0, but I’m finding my model returns values that range from 0 to as high as 35000. I can dig deeper (it appears to be the first element returned by Learner.pred_batch()), but I wanted to ask first. I suspect its the last layer’s output before a nonlinear activation function is applied to these values (to bound to [0,1])?

I wanted to visualize these probabilities for the dataset I was working with . Here are some examples - some are mislabeled but I found the classification outputs interesting nonetheless. These are directly plotting the classification probabilities returned by learner.predict:


1 Like

@myltykritik One way to look at this is to compare the training/validation pictures with the test/inference datasets.
If the inference-time images also contain information in text or watermarks, in other words, they are both roughly the same, then it is ok to keep the labels/watermarks, and let the model learn to use them.
For example, if you want to train for traffic signals, its ok to have the “STOP” inside the stop sign.
But to train a classifier that would work well on images that have no such text/watermarks,
you should remove them from the images…

I do apologize for the mistake.
I edited the post removing the “@”.

Thanks,
d

2 Likes

This is definitely sign of overfitting. Both best val_loss and accuracy were achieved in epoch 3. And val_loss just keeps increasing after that.

For your first question, have you tried plotting the entire (not truncated) graph?

Well he could certainly do that and maybe he would see an upward slope. But that would mean that the optimal learning rate is smaller than 10E-6. This seems suspiciously small given the learning rates we usually use.

It suggests you don’t need to unfreeze and fine-tune the lower layers. Is that what you found when you tried?

1 Like

I wonder why we download and use only .jpg images? Could we use .png or other types of images mixed together or even only .png type images? What is the difference and couldn’t we just somehow convert type from .png to .jpg?

1 Like

That’s an interesting idea. But we might end up with too many categories (28 * 4).

I’ve no experience in running with that many categories. But I have seen some good results even with such an amount in some other threads.

Give it a try :smiley:

1 Like

Yes.

Lot of work already done in this area.

One example. [Project] Fully convolutional watermark removal

There are more resources that make it easy to remove watermarks.

3 Likes

You could. I believe Resnet works with both image types. This article may help

https://arxiv.org/abs/1604.04004

2 Likes

Nothing changes, actually. It just happens that the loss surface is a N-dimensional hypersurface embedded in a N+1-dimensional euclidean space.
It still got maxima and minima (but see below), and it’s generally quite bumpy. For, we make good use of cyclical learning rates and restarts: they’ll get you out of bad local minima.
Another important consideration is that as the dimensionality increases, almost every stationary point is a saddle point (= ability to escape).
This is not difficult to believe: intuitively, imagine a stationary point on a thousand-dimensional surface. For it to be a saddle point, it just suffices that it’s not a maximum/minimum with respect to one coordinate axis.

Yes. The research community is starting to think about the loss surface not as embedded in a euclidean space (and thus inheriting its metric), but as a standalone non-euclidean manifold with its own intrinsic metric.
It would be great if @rachel could write an article about it.

2 Likes