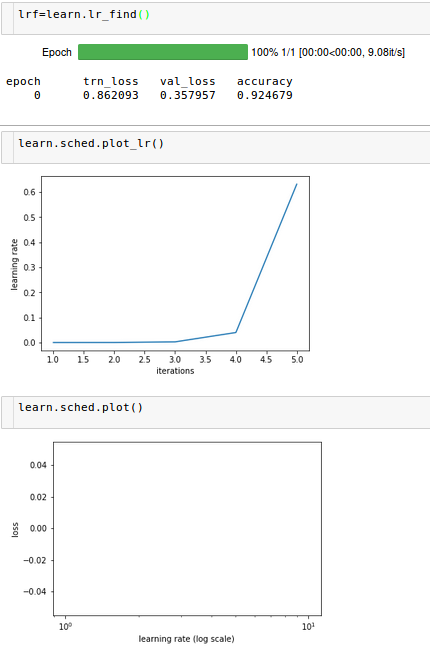
and after that, learn.sched.plot() doesn’t show anything.
I was under impression, that lr_find() shouldn’t complete. Any ideas?
I have this issue for my custom dataset of around 35 images. That is, nothing shows up at all.
I’m wondering if anyone can tell me why this would be the case? I’m obviously not too concerned due to my tiny dataset, but am curious as to what is going on ‘under the hood’ to explain this. Obviously with the supplied ‘dogscats’ dataset, I get the result in the lectures.
Maybe a clearer explanation of what is actually going on under the hood here? I must admit that it hasn’t all sunk in properly/intuitively at the moment.
Here Lesson 1 part 1 v2 custom images u/priyal was able to do it with 40 images. I got two datasets, with 500 (comparing windsor and chinese chairs) and 700 images (oak trees with bonsai trees), both had the same problem. Dogscats was ok.
I’m also not too concerned, and moved on  Ended up just playing with different learning rates “by hand”.
EDIT: I see that @priyal reduced batch size, I will check later if this helps
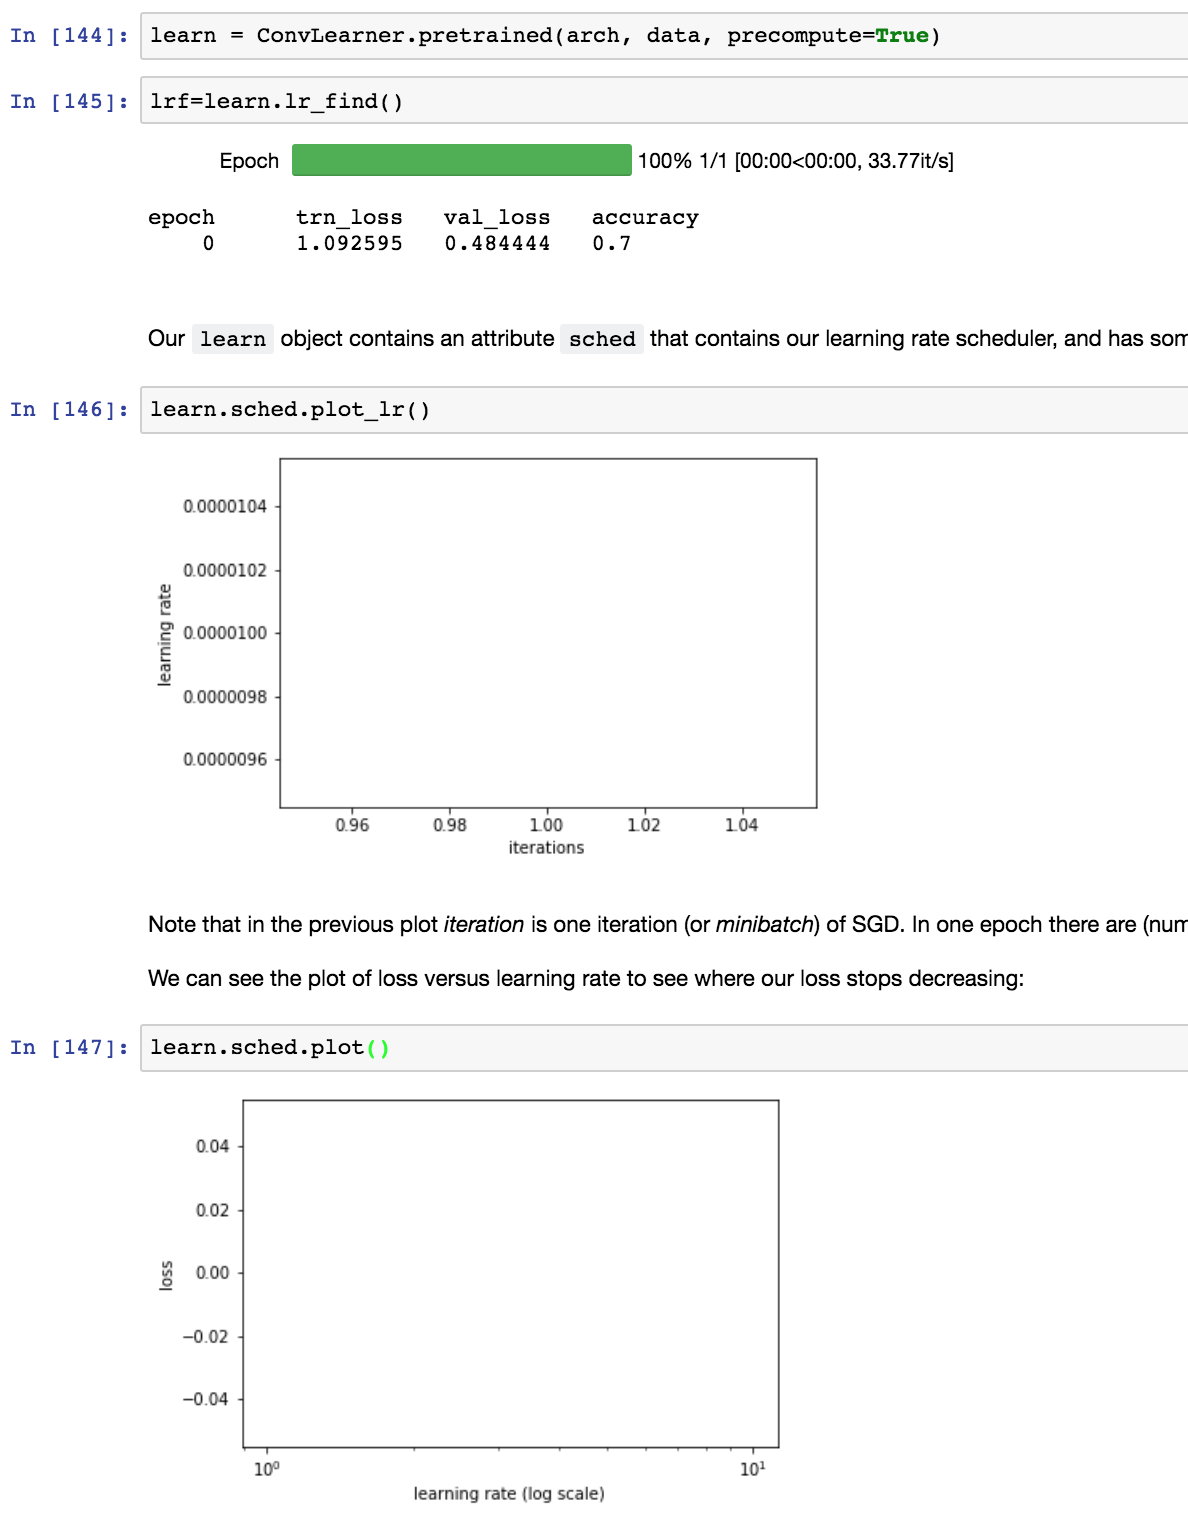
Most likely, your batch size is bigger than the number of images.
lr_find runs one mini-batch with single learning rate, and gets loss for this LR value.
If batch size > number of images, you get one single point on the graph: so you don’t see any line.
This is explained here: Wiki: Lesson 1
1 Like
Changed batch size to 8 and learning rate plot started to appear. Thanks!
Although, it didn’t helped me much, heh (too small dataset). But small dataset also meant that I could experiment fast with other lr values.
1 Like