Learn.fit_one_cycle makes me run out of memory on CPU while I train on GPU

I have the following issue which is super weird. I create a learner that I want to fit. My learner is on GPU and uses the GPU to train. However, when I call
learn.fit_one_cycle
My memory usage (my real memory, not my GPU memory) goes up as time goes by until nothing is left. I have really no idea where this is coming from. I have successfully trained the same model on a different dataset without issue. The only difference is that I used to load my data from images, and now my data is loaded with torch.load with a custom ImageImageList :

class TensorImageImageList(ImageImageList):  
    def open(self, fn):
        return torch.load(fn).type(torch.float)

If you have any idea, i’m interested !

1 Like

torch.load will put things on the GPU if you had them there when you saved. You should add map_location='cpu' (or something like that).

Good point ! I’ll make the change. In my case, I saved those while having them on CPU, so my error is not coming from there.

I created a minimal notebook to reproduce the bug. Interesting fact : the memory usages goes up on each epoch but memory is freed at the end of each epoch. In my current situation, I have 1 million tensor to process so I run out of memory before reaching the end of the epoch.

Here’s a link to the repo containing the notebook : https://github.com/StatisticDean/fastai_memory_cpu

New note : I ran the code with real images again, and I also noticed an increase in memory usage during training. However, it was much lower, which means that the model should probably be able to train without eating all my available memory. I still don’t understand why memory usages go up during each epoch while i’m training on GPU.

After some digging on the forums, CPU RAM Usage Keeps Growing as Training One Cycle, RuntimeError: DataLoader worker is killed by signal, Does DataLoader have multithreading memory leak issues? discuss the same issue. I will share an answer on this thread if I find one.

Following the suggestion of RuntimeError: DataLoader worker is killed by signal, I tried using a num_workers of 0 when creating my databunch, unfortunately, this didn’t resolve my issue. (By which I mean the process ate all the RAM during the training of the first epoch).

Weird finding, when setting num_workers to 0, the RAM usage stays constant during the early batch (up to around batch 70), and then goes up like before.

Quick recap of my issue and what I tried yet:

  • I have a model (it’s a Unet) that can be trained perfectly by loading images(memory usage stays constant during training). If i want to load tensor directly by creating a custom ImageImageList class, and overriding open, I get a memory usage that increases linearly in each epoch and takes up all my RAM(according to my calculation, memory usage would go up to 480 Go if my memory was unlimited).
  • I created a minimal example of this issue by creating a random dataset and trying to train a resnet.
  • From what I read, the issue might come from multithreading and can be fixed by setting num_workers to 0. This didn’t work in my case memory still goes up.

This memory leak seems to exist when using images but to me much less impactful since it takes a lot less space than tensor (int8 vs float32).
I could really use some help to fix this issue. Since memory is cleared between epochs, maybe there is a way to force the memory to be cleared every few batch (Jeremy suggested that in one of the thread I linked). I’m going to look into that now.

1 Like

New results of investigation :

  • I tried calling the gc every few batch by creating my own training scheduler, this didn’t fix the memory leak.
  • I tried updating my pytorch, this didn’t fix the memory leak.
  • The leak is coming from the dataloader : If I do
for xb, yb in learn.data.train_dl.dl:
    pass

It eats up all my memory. I checked and learn.data.train_dl.dl.num_workers is equal to 0 in my experiment so i got the leak even with num_workers set to 0. I think a solution would be to replace the for loop and goes through a small number of batch at a time. If any of you already had to do a similar thing, I would be very grateful if you could share how you did it.

After some closer inspection, I noticed that the default open method returns an Image which is a class of fastai instead of returning a tensor. So I changed my

class TensorImageList(ImageList):
    def open(self, fn):
        return torch.load(fn, map_location='cpu').type(torch.float)

with

class TensorImageList(ImageList):
    def open(self, fn):
        return Image(torch.load(fn, map_location='cpu').type(torch.float))

And magic, memory is stable (at least if you just iterate through the dataloader). This took me way too long to figure out :laughing:
I’m still interested in figuring out why not calling Image caused the memory leak, if you have any idea, i’m interested. At the moment, I’m going to finally train my model, but I might come back to this later to investigate.

2 Likes

Ah! I think this might be due to our data_collate default function, which collected the data inside your tensor instead of just grabbing your tensor.
Why that didn’t release memory is beyond me, but I think if you pass to the call to DataBunch the regular pytorch collate function (which is torch.utils.data.dataloader.default_collate) you won’t have a memory leak.

Well, adding Image to my custom open function worked like a charm :slightly_smiling_face:
It’s interesting that the problems come from the data_collate, because I would never have looked there for at least a few more days.
I’m just really happy to finally be able to train my model. I was pretty desperate to find a solution after what seemed like hours without progress, I even made this a few days ago :
30cxge
But I figured out, I would still search a little by myself before posting this on the forum :grin:

1 Like

I like the meme a lot! :slight_smile:
And I was watching you struggle but didn’t have any idea of what was going on either, which is why I didn’t reply. Glad you found the source!

1 Like

In the end, it was pretty instructive, I think I understand new things about the data_block api and now, I know a lot more about what happens “behind the scenes” when iterating through a dataloader. You’ve been very helpful to me on this forum many times, I can’t expect you to fix every single one of my issues :slight_smile:

Hi I have started using fast ai, I am running into the same issue as well, my cpu usage is at 100% but GPU usage stays very low. I wanted to ask how do you pass “torch.utils.data.dataloader.default_collate” like to which function and what the api ?
#https://github.com/sheecegardezi/govhack2019/blob/master/parking/Car%20Parking%20System.ipynb

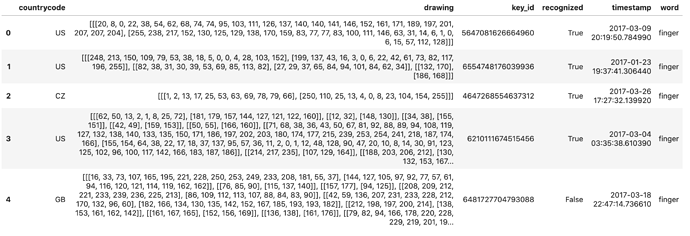
I am facing the same issue with the FastAI v2 library. I am trying to work on Kaggle’s QuickDraw dataset. The data comes in the form of a CSV file like below:

The “drawing” column represents the drawing data points from which we can construct an image while the “word” column represents the label. Now of course, I can first create and save the images into folder and then train a Fastai model in the general imagenet way, or I could generate the images on the fly.

The drawback of the first method is, It will take forever to save the images to disk, not to mention the storage space. The better way is to generate it the images on the fly.

So I wrote the following Datablock to be able to do it.

# Function to generate image from strokes
def draw_to_img(strokes, im_size = 256):
    fig, ax = plt.subplots()                        
    for x, y in strokes:
        ax.plot(x, -np.array(y), lw = 10)
    ax.axis('off')
    
    fig.canvas.draw()                               
    A = np.array(fig.canvas.renderer._renderer)     # converting them into array
    
    plt.close('all')
    plt.clf()
    A = (cv2.resize(A, (im_size, im_size)) / 255.)  # image resizing to uniform format

    return A[:, :, :3]

class ImageDrawing(PILBase):
    @classmethod
    def create(cls, fns):
        strokes = json.loads(fns)
        img = draw_to_img(strokes, im_size=256)
        img = PILImage.create((img * 255).astype(np.uint8))
        return img
    
    def show(self, ctx=None, **kwargs): 
        t1 = self
        if not isinstance(t1, Tensor): return ctx
        return show_image(t1, ctx=ctx, **kwargs)

def ImageDrawingBlock(): 
    return TransformBlock(type_tfms=ImageDrawing.create, batch_tfms=IntToFloatTensor)

And here is the full datablock:

QuickDraw = DataBlock(
    blocks=(ImageDrawingBlock, CategoryBlock),
    get_x=lambda x:x[1],
    get_y=lambda x:x[5].replace(' ','_'),
    splitter=RandomSplitter(valid_pct=0.005),
    item_tfms=Resize(128),
    batch_tfms=aug_transforms()
)

data = QuickDraw.dataloaders(df, bs=16, path=path)

With this, I am able to effectively create the images on the fly and train the model. But the problem is, mid training, Just like the original author of the question, I have the same problem with my 64 GB RAM eventually being completly used up. :frowning: Its exactly as the author has described.

I tried the solution which seemingly worked for the author, but it doesnt work for me. Im using the V2 Library and by this point I have spent quite some time trying to fix this, would really appreciate any help!

Thanks in advance. @sgugger @StatisticDean

P.S. The 'Docs" and “Tutorial” links in this github discussion https://github.com/fastai/fastai/issues/2068 gives a 404 not found error. :frowning:

So I found a solution to this problem! But it is quite unconventional though. What I found out is that when I run the training code as a regular python file on the terminal, I dont have the memory issue.

Its probably got something to do with how Jupyter notebook stores variables and garbage collects. When I run the code on the notebook, Its probably allocating a memory equivalent to a the whole dataframe for each batch iteration. Or thats atleast thats what I think is happening, which learnt to rapid RAM consumption.