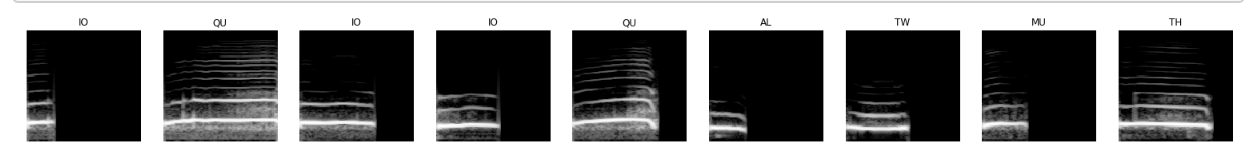
What a great information Radek. I have little knowledge about physics and signal processing so I will play around preprocessing the signal. Like for human, we can hear the signal from 20 Hz to 20 KHz, and look at the picture I can see that we don’t have much information in the very low and very high frequency. I’m thinking about cutting the vertical input or changing scale to log-scale for example. For deeplearning, I’m still behind you guy so I’m still practicing now following the great resources you gave us.
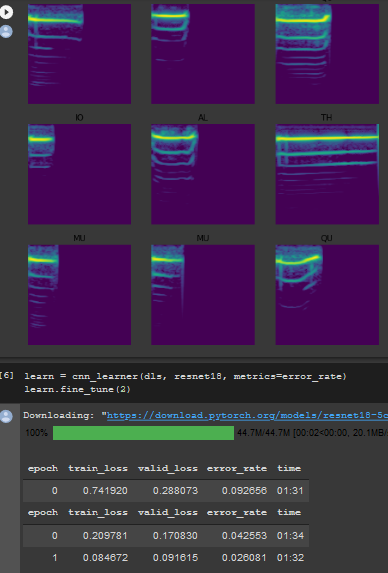
Below is the result I got with cutting the image with spec = spec[10:50] and I got little bit better result compared to the default resnet18
Heey, I want to try something a bit different, something like self-supervised learning or auxiliary losses. I still need to implement all the great ideas shared here to see how this all will play out
The first thing we need is to find something to predict in the data that is already in the data, something we don’t directly have the labels for. We can be really creative here and try to predict anything we want, for starters I went with duration.
The two approaches are:
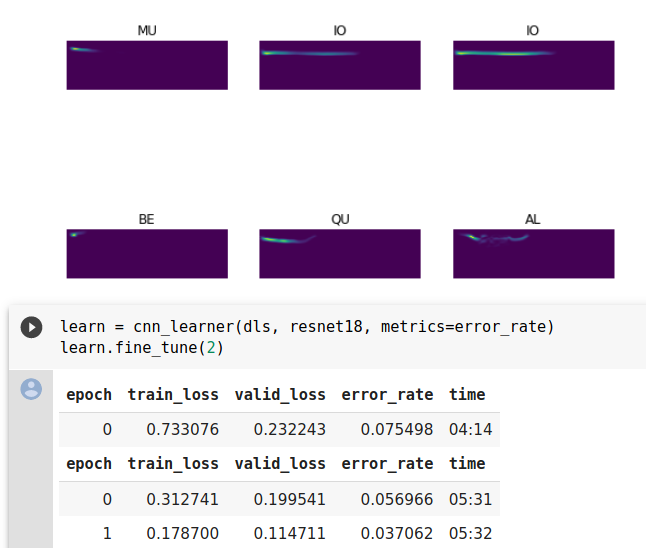
self-supervised: First train a model to predict the audio durations, then use transfer learning to use those weights on the classification task. The idea is that first step of training should help our conv layers to learn useful representations for this specific kind of data.
Auxiliary losses: Instead of only predicting the classes, we can also simultaneously predict the duration. This extra loss should help the training process, (it acts like an additional guide on where to move the weights). (Not yet implemented)
Preliminary results:
Okay, so the results are a bit confusing, you can find a table of some of the experiments I ran at the end of this nb.
First shocking result:
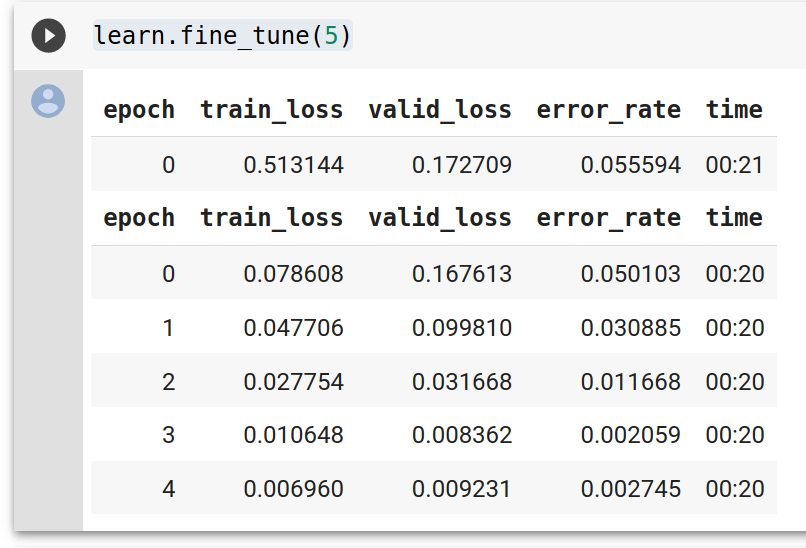
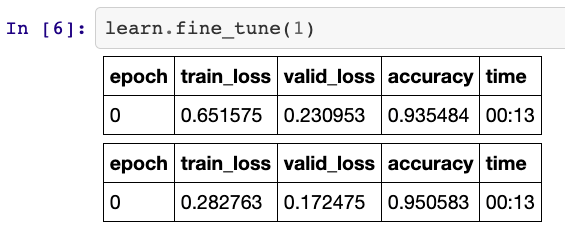
Take a look at this:
.93 acc after the first freezed epoch, not out of the ordinary you might say… Well, this was NOT a pretrained model, so all the convolutional layers are just random weights. fine_tune calls freeze for the first epoch, so only the head of the model was trained, and still we achieved .93 accuracy?? Seems extremely fishy… The result was even better than when I loaded the learned weights from the duration task!!
Other not so shocking result: All of this pre-training on duration task seemed to make no difference at all … Maybe the task is too easy? Maybe there is something wrong in the code…
After you build your model, call learn.freeze() then look inside learn.summary(). What does tell you about trainable vs non-trainable parameters. (This represents a mock start to fine_tune)
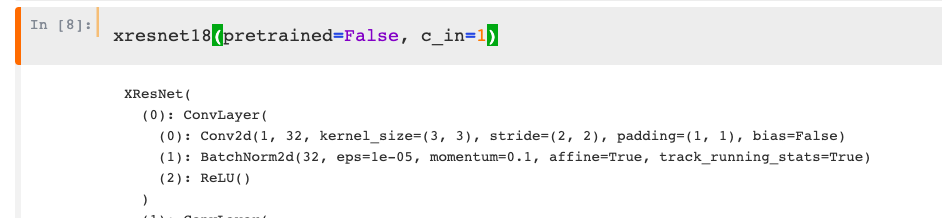
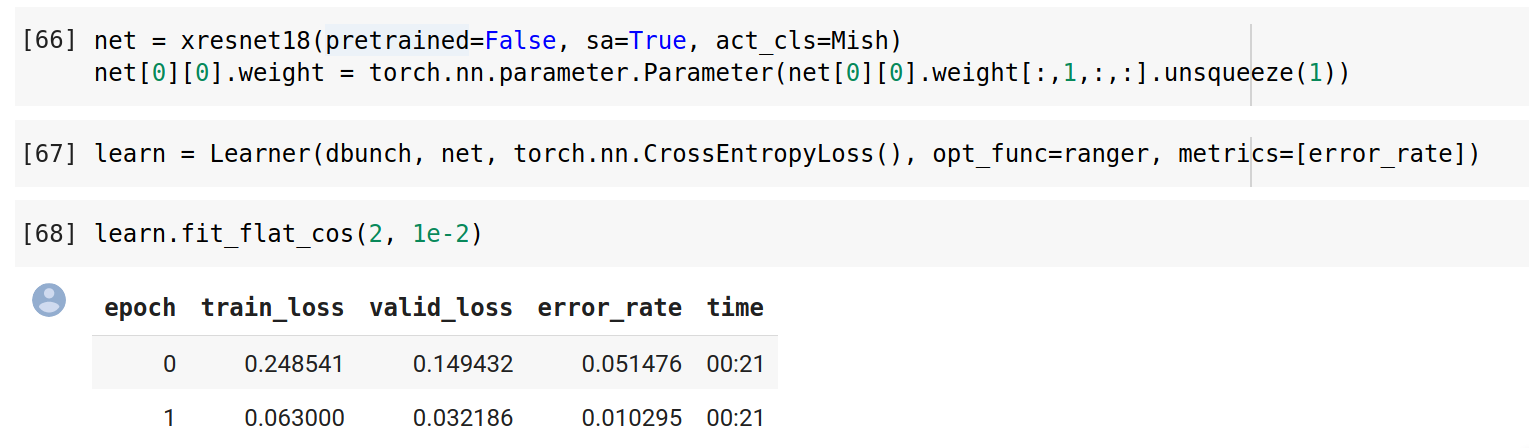
To be honest, I’m not sure if we’re going to be able to beat 99.7% accuracy! I changed the batch size to 32, played around with deeper models (34- and 50-layer xresnets), and tried changing the pretrained layer in the resnet stem (i.e., @adpostma used channel 1, but you could take the average or sum of the three, or select one of the others). The results almost always bottomed out with 0.003-0.004 error rate.
In one run I randomly got the error_rate to dip down to 0.002 but that’s clearly just validation set luck!
Yep! To be more clear I meant early stopping validation luck, since I got 0.002 error rate in epoch 5/6. (Also, this run was basically the same as @adpostma’s except with bs=32.)
Just throwing in my two cents here. Because we are all using the same validation set, we may be selecting architectures and tuning hyperparameters to that particular set, especially when the error rate goes down nearly to zero. With a different training/validation split, different solutions may rise to the top.
Does anyone understand how to assess this issue statistically? I imagine there’s a formula that relates variance of error rate to the the size of the validation set. I’m not enough of a mathematician to find or derive it.
In any case, you could pick some different seeds and see empirically how the accuracy varies.
It would probably be a good idea to double check that indeed the model was trained from scratch. If you re-initialize the weights and train, are you seeing a similar result?
Even if you are, well, this result sounds so good it seems a little bit suspect, but there is another aspect to CNNs that is very interesting that might be coming into play here. Even with random weights, the CNN is still doing something interesting in the context of vision. It is running all these tiny kernels across an image. The idea is that the CNN architecture is so good at doing something useful in the context of looking at an image, that the architecture is so geared towards this task, that even with random weights it is doing giving useful outputs, it is producing signal from the image that we can work with!
I don’t have a good paper to reference, but I have come across some form of this at multiple times. A quick google search returned this but I only scanned this, this is not any of the papers I read about this in the past.
With a sufficiently large CNN and relatively simple task, if you were to randomly initialize the CNN part, freeze it, and just train a classifier on top of it, you probably might get results that seem to good to be true If anyone would like to verify that, maybe grab MNIST, and then on top of a CNN train a linear layer and / or a complex head like the one in fastai2. If you do so, please let us know what the results of this were :). I think you might be quite surprised and maybe the result you are getting here is not that way off
These formulas are super fun but very impractical Any result we might get based on such theoretical calculations would probably be in terms of bounds and not very useful.
But I certainly see what you mean. Yes, this can be happening but we already have a lot of data in the validation set (~1400 examples) so this effect should probably not be that pronounced. We are also all getting decent results and it would be surprising that we all got that lucky that a different seed should change things much
My intuition tells me that what might be happening is this
The task is probably easy enough, especially as we are rolling out some really big guns to tackle this (pretrained, state of the art archs).
But I think we can still learn a little bit on this data. Can we construct our own, simple arch and how well will it do? What if we add to it the coord conv idea from the uber research I linked to? Would there be a difference? Can we preprocess the data ourselves to get similar results as were achieved using fastai2 audio? What did they do there to get such nice spectrograms?
I am on the lookout Finding high quality, fun datasets is unfortunately not that easy, especially as a lot of data still sadly is propriatery.
Yes, and you know the crazy thing? Everyone that is using xresnets (apart from xresnet50) is training the model from scratch, only xresnet50 have pretrained weights so far… This should not be a surprise, but I only came to realise that now lol
Very interesting thoughts indeed… If you think about it, some of the random weights would eventually form useful image filters, it does make sense, but I never realised that haha, thanks for sharing this insight!
After researching what they did in the fastai.audio repo, I think that the most interesting thing we miss here is the logscale .What make their spectrogram so colorful. The difference in audio power is too much then if we stay in power so we loss a lot of information in frequency.
For detail, they define def SpectrogramTransformer(mel=True, to_db=True): means the signal is changed to decibel (or in logscale).
Can I also suggest the addition of: np.flip(spec, axis=0)?
This would flip the image vertically, putting low frequencies at the bottom. No real difference to the model, but I think its more natural for us humans to understand

 … Maybe the task is too easy? Maybe there is something wrong in the code…