What kinds of feature importance metrics are used in deep learning? For image data, I know Class Activation Mapping is popular, but what about text data (attention mapping?) and structured data?
I second that question. In RandomForest we do have feature_importance_ and it is very useful if you want to explain your conclusions to your client. Any similar methods available in learner to find most important features and correlation between features?
In any case, with structured data, there are myriad methods such as the ones that come with sklearn (F-test, chi2, etc.), and permutation importance (https://academic.oup.com/bioinformatics/article/26/10/1340/193348), but I was wondering if there were any measures recommended with deep learning setups.
I was searching for feature importance tools for the tabular learner. I only found an old function for fastai 0.7, so I refactored it for the current version. Maybe it helps:
def feature_importance(learner, cat_names, cont_names):
  # based on: https://medium.com/@mp.music93/neural-networks-feature-importance-with-fastai-5c393cf65815
  loss0=np.array([learner.pred_batch(batch=(x,y)).mean()-y.mean() for x,y in iter(learner.data.valid_dl)]).mean(); loss0
  fi=dict()
  types=[cat_names, cont_names]
  for j, t in enumerate(types):
    for i, c in enumerate(t):
      loss=[]
      for x,y in iter(learner.data.valid_dl):
        col=x[j][:,i]
        idx = torch.randperm(col.nelement())
        x[j][:,i] = col.view(-1)[idx].view(col.size())
        y=y.to('cpu')
        loss.append((learner.pred_batch(batch=(x,y))-y).mean())
      fi[c]=np.array(loss).mean()-loss0
  d = sorted(fi.items(), key=lambda kv: kv[1], reverse=True)
  return pd.DataFrame({'cols': [l for l, v in d], 'imp': np.log1p([v for l, v in d])})
9 Likes
Thanks a lot Bernd, nice work.
thanks @jeremyeast
With the above function I get a somewhat strange result for the Kaggle HousePrice competition:
fi = feature_importance(learn, cat_names, cont_names)
fi[:20].plot.barh(x="cols", y="imp", figsize=(10, 10))
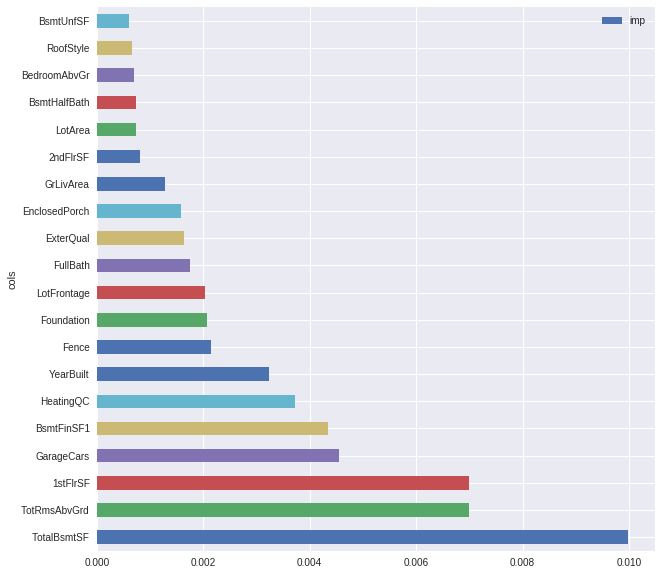
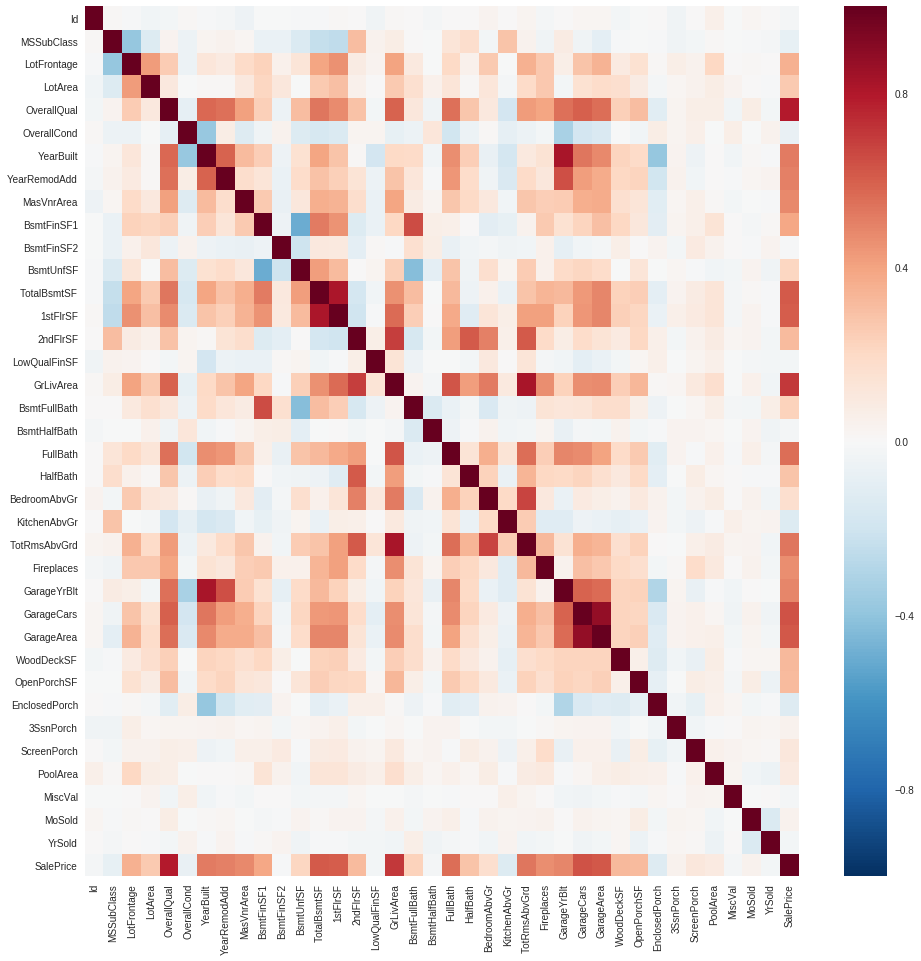
This doesn’t fit very well with the correlation matrix. For example: OverallQual has the biggest correlation and doesn’t even show up in the plot of feature importance.
So I refactored the function again to use the builtin loss function of the learner:
def feature_importance(learner, cat_names, cont_names):
  # based on: https://medium.com/@mp.music93/neural-networks-feature-importance-with-fastai-5c393cf65815
    loss0=np.array([learner.loss_func(learner.pred_batch(batch=(x,y.to("cpu"))), y.to("cpu")) for x,y in iter(learner.data.valid_dl)]).mean()
    fi=dict()
    types=[cat_names, cont_names]
    for j, t in enumerate(types):
      for i, c in enumerate(t):
        loss=[]
        for x,y in iter(learner.data.valid_dl):
          col=x[j][:,i]    #x[0] da hier cat-vars
          idx = torch.randperm(col.nelement())
          x[j][:,i] = col.view(-1)[idx].view(col.size())
          y=y.to('cpu')
          loss.append(learner.loss_func(learner.pred_batch(batch=(x,y)), y))
        fi[c]=np.array(loss).mean()-loss0
    d = sorted(fi.items(), key=lambda kv: kv[1], reverse=True)
    return pd.DataFrame({'cols': [l for l, v in d], 'imp': np.log1p([v for l, v in d])})
Here i get way better results:

7 Likes
Check this library: https://github.com/slundberg/shap
2 Likes
thanks @axelstram
Did you get a fast.ai model working with shap?
This is extremely important in medicine where serious life and death decisions could be made for a patient on the basis of the prediction, and quirky but rare model failures could be deadly. Also in medicine, the users need to trust the predictions.
In NLP, @bfarzin found undocumented software in the fastai library, and he documented it here:
https://docs.fast.ai/text.learner.html#TextClassificationInterpretation
This enables you to use attention with the AWD_LSTM models, and assign colors like heat maps to the input phrases that have the greatest importance in the prediction.
Jeremy mentioned in his excellent ML-Course a library called pdpbox which produces really nice Partial Plots. The idea is a bit similar to Permutation Importance, but instead filling a column with randoms you fill all rows with certain values from a list, predict the outcome and repeat with the next value. You can see how a specific variable changes the outcome, if all other variables are constant.
Unfortunately pdpbox only works with scikit-learn-models. I guess we would need a wrapper, to make a fast.ai-learner work with pdpbox. As I was not able to build such a wrapper (if its possible at all) I wrote a function to see if I can make my own plots.
def partial_dependence(learn, df, feature):
  pdi=dict()
  steps=30
  ci=learner.data.col_names.index(feature)
  is_cat=feature in learn.data.get(0).classes
  if is_cat:
    vals=learn.data.get(0).classes[feature]
    j=0
  else:
    j=1
    vals= np.linspace(df_train[feature].min(), df_train[feature].max(), num=steps)
    if vals[-1]-vals[0]>steps:
      vals=np.floor(vals).astype("int")
    ci-=len(learn.data.get(0).classes)
    mean=df[feature].mean()
    std=df[feature].std()
  baseY=np.array([learn.pred_batch(batch=(x,y.to("cpu"))).mean() for x,y in iter(learner.data.valid_dl)]).mean()
  for i, val in enumerate(vals):
    ys=[]
    for x,y in iter(learner.data.valid_dl):
      x[j][:,ci] = torch.full((x[j][:,ci].shape), i if is_cat else (val-mean)/(1e-7+std))
      y=y.to('cpu')
      ys.append(np.array(learner.pred_batch(batch=(x,y))).mean())
    pdi[val]=np.array(ys).mean()-baseY
  if is_cat:
    d = sorted(pdi.items(), key=lambda kv: kv[1], reverse=True)
  else:
    d=list(pdi.items())
  return pd.DataFrame({'vals': [k for k, v in d], 'diff': [v for k, v in d]})
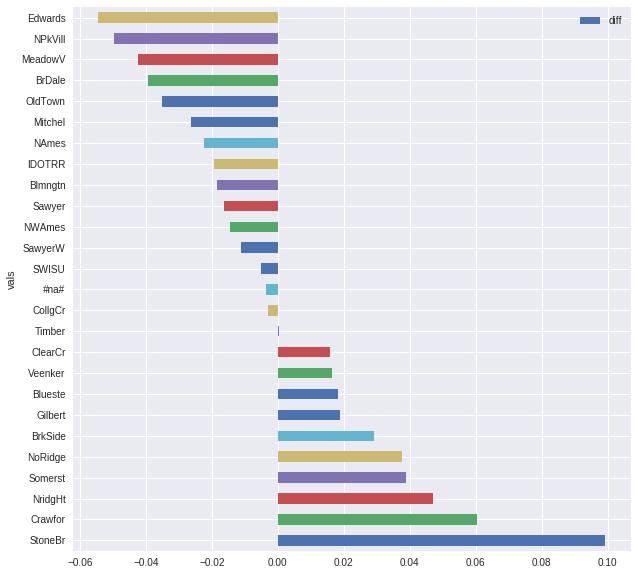
Here two examples from the HouseDataset:
pdi=partial_dependence(learner, df_train, "Neighborhood")
pdi.plot.barh(x="vals", y="diff", figsize=(10, 10))
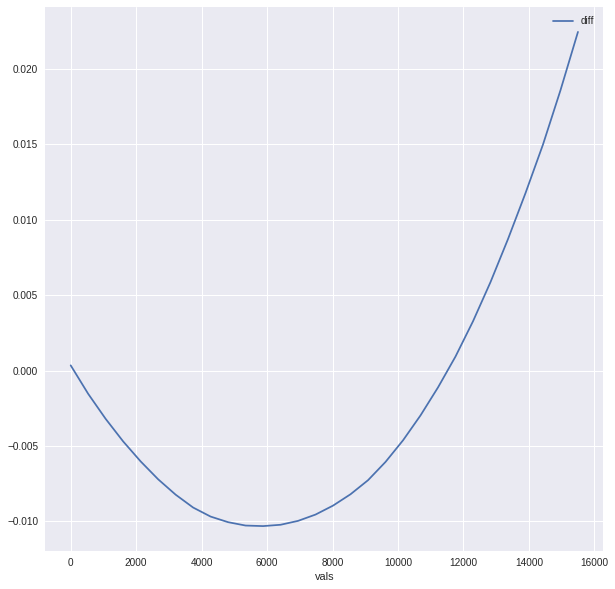
pdi=partial_dependence(learner, df_train, "MiscVal")
pdi.plot.line(x="vals", y="diff", figsize=(10, 10))
4 Likes
I’ve only used it for tree based models but there is the SHAP package in by Scott Lundberg which has functionality for neural networks or any other black box model. It’s based on game theory principles and for tree based models this is what I use religiously. Native feature importance metrics in tree based models have shortcomings and what’s nice about SHAP is that a individual prediction can be deconstructed as opposed just have a global feature attribution.
1 Like
Thank you, @bernd.heidemann, This will help a lot for explaining the model. I also want something that will explain a single prediction, in the NLP context. For instance, if the model is state-of-the-art, overall, but has a rare example of “catastrophic failure”, I want the medical provider to know whether their patient’s prediction is a catastrophic failure before they make clinical interventions on the basis of that one prediction.
We had a story when our ICU research scientist was trying to predict probability of death from clinical notes. The best feature in the model was the fact that the family was visiting the patient. Of course the kids are only going to fly in from the other side of the country if someone else has told them that the father is about to die. So that wasn’t the signal we wanted. If we could highlight that phrase “family visit”, then the provider will know to discount that prediction.
Thank you @Hannibal! I googled SHAP and Scott Lundberg, and this looks like great and relevant work, though it looked hard to implement. As @axelstram mentioned, Lundberg has a really great README at his github here:
In this README, he references “Deep SHAP” where he applies his method to Deep Learning, and implements it in Keras/TensorFlow. He also mentions that there is some preliminary support for PyTorch, and I found it deeper in the same github tree here:
https://github.com/slundberg/shap/tree/master/shap/explainers/deep
I don’t understand how it all works, other than it seems to go quite a bit deeper than a simple “attention” model. For a look at how deep the rabbit hole goes, there is a very nice video from 2017 by the group that created a related method, “DeepLift”. Like Jeremy’s lessons, this video is very clear and very deep!
@danaludwig thanks for the video! Very interesting approach!
As far as I could see, it should be possible to use SHAP with a custom pytorch-model. But we would loose a little bit convenience, for example the automatically generated embeddings for Tabular Data…
1 Like
This is exactly what I was looking for as I was having difficulties with the previous one due to my loss function. Thank you!!!
Just going to tag on this a little bit, I re-fractured the code to where now you just need to input the learner.
def feature_importance(learner):
  # based on: https://medium.com/@mp.music93/neural-networks-feature-importance-with-fastai-5c393cf65815
    data = learner.data.train_ds.x
    cat_names = data.cat_names
    cont_names = data.cont_names
    loss0=np.array([learner.loss_func(learner.pred_batch(batch=(x,y.to("cpu"))), y.to("cpu")) for x,y in iter(learner.data.valid_dl)]).mean()
    fi=dict()
    types=[cat_names, cont_names]
    for j, t in enumerate(types):
      for i, c in enumerate(t):
        loss=[]
        for x,y in iter(learner.data.valid_dl):
          col=x[j][:,i]    #x[0] da hier cat-vars
          idx = torch.randperm(col.nelement())
          x[j][:,i] = col.view(-1)[idx].view(col.size())
          y=y.to('cpu')
          loss.append(learner.loss_func(learner.pred_batch(batch=(x,y)), y))
        fi[c]=np.array(loss).mean()-loss0
    d = sorted(fi.items(), key=lambda kv: kv[1], reverse=True)
    return pd.DataFrame({'cols': [l for l, v in d], 'imp': np.log1p([v for l, v in d])})
7 Likes
@bernd.heidemann I’m just now taking a udemy course on feature selection in hopes to get a bit better with this. How would I go about implementing if two variables are in high correlation with each other? Scramble two columns at the same time instead of one? (Double permutation)?
Thanks!!!
@muellerzr I have no idea if Double Permutation will yield good results, but i would try on a well kown dataset. Maybe combined partial dependence plots would also be a woth a try.
@bernd.heidemann Does your code for the partial dependency work still above? When I try it on the ADULTs dataset diff is always zero regardless of the variable or type
@muellerzr Wanted to say thank you for this. It’s really fantastic.