Hi Cedric, Can you share a link to these notes? Thanks.
Hi, I should have been clearer. When I say “the lesson/lecture notes”, I meant to refer to timlee’s notes which is already in this forum in the form of wiki threads. An example of these notes:
Understood, thanks for the clarification.
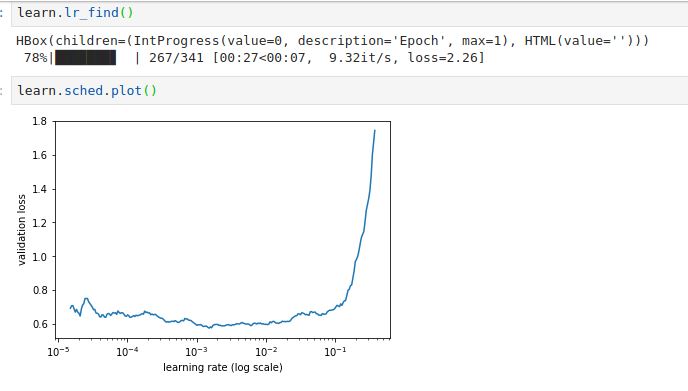
Here is how my learning rate curve is looking. I’m not sure why. It doesn’t look anything close to what we see in cats vs dogs curve.
Just for the reference cats and dog’s learning rate curve looks like the one below.
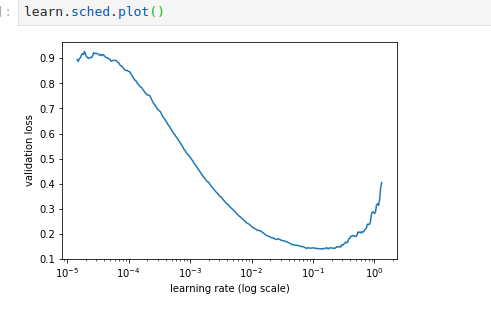
Clearly something is wrong with the plot I’m getting for my dog-breed identification.
Can anyone please let me know about the learning rate curve they are getting?
Okie I tried few more things. here is what I found.
In the example code “learn = ConvLearner.pretrained(arch,data, precompute=False, ps=0.5)”
Notice the additional ps=0.5. With that Y-axis starts at 1.8 which is higher compared to 0.9 in the case of cats vs dogs lr_find().

Which results in the graph as below.
I removed that ps=0.5 value and now I’m getting the graph as shown below.
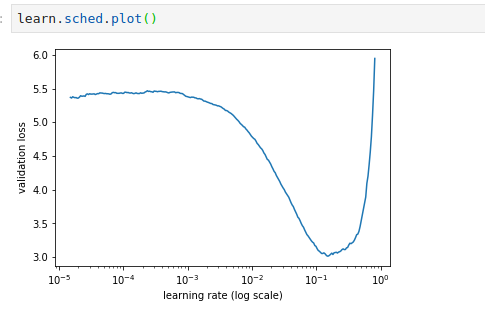
But now the Y axis is in the range 3 to 6. Looked in to the documentation for the class ConvnetBuilder
ps (float or array of float): dropout parameters
Not sure what droput parameter is at this moment. May be I’ll get to know in future lessons.