Why this topic
Italy has been the first country of the “western world” to experience Covid-19. The virus outbreak hit the other countries in Europe in the Americas later on. Those countries may benefit of this time-lag (about 2 weeks, I believe) and learn from what happened (and what is happening) in Italy to improve their response.
The intent is to share information and data, especially those taken from official sources.
Sources
Primary data source is a GitHub Repository owned by Italian “Dipartimento della Protezione Civile” (Civil Protection Department) that is in charge to coordinate the response to this emergency in collaboration with other Public Administration Agencies or Departments (i.e. Italian Ministry of Health).
All information in the repository are in Italian, but most of them are also translated in English.
Official data are provided since Feb 24th, 2020. We have no official data for previous days. You may refer to 2020 coronavirus pandemic in Italy page in Wikipedia for information on cases observed before Feb 24th.
Trends
I made an attempt to process the data to highlight the trends we are experiencing in Italy.
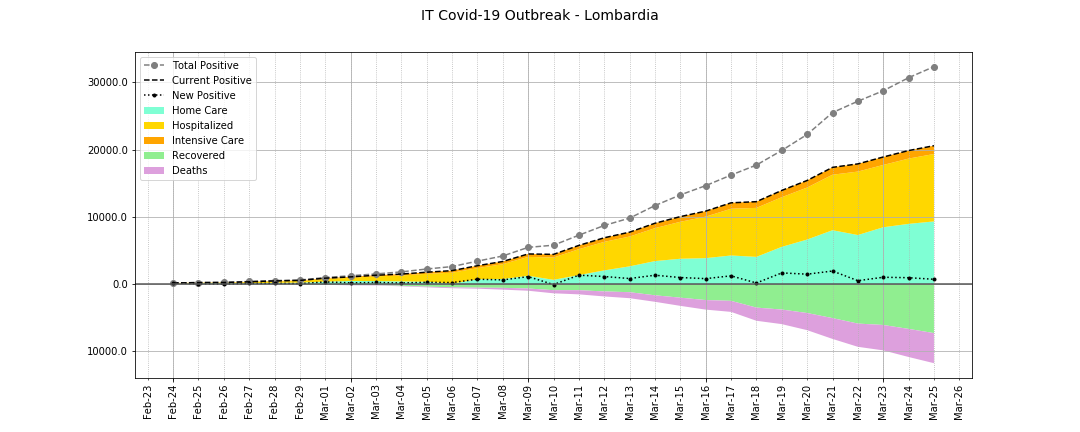
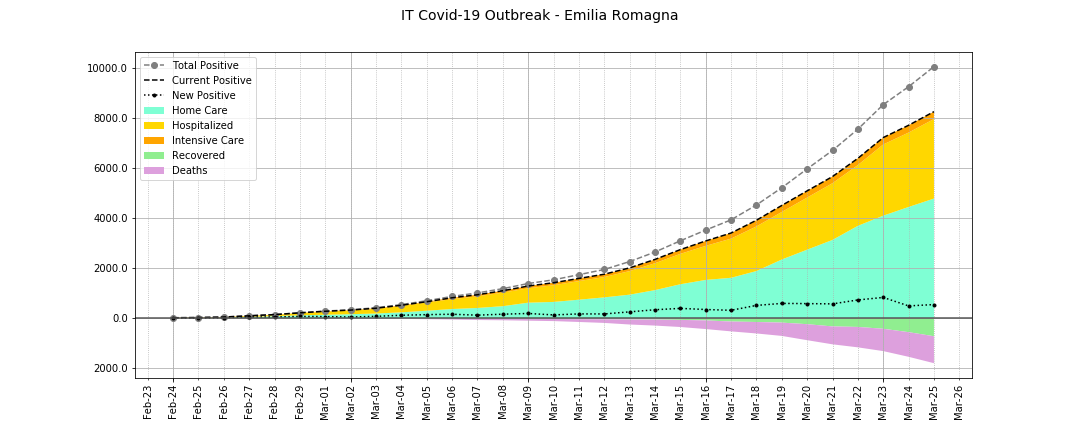
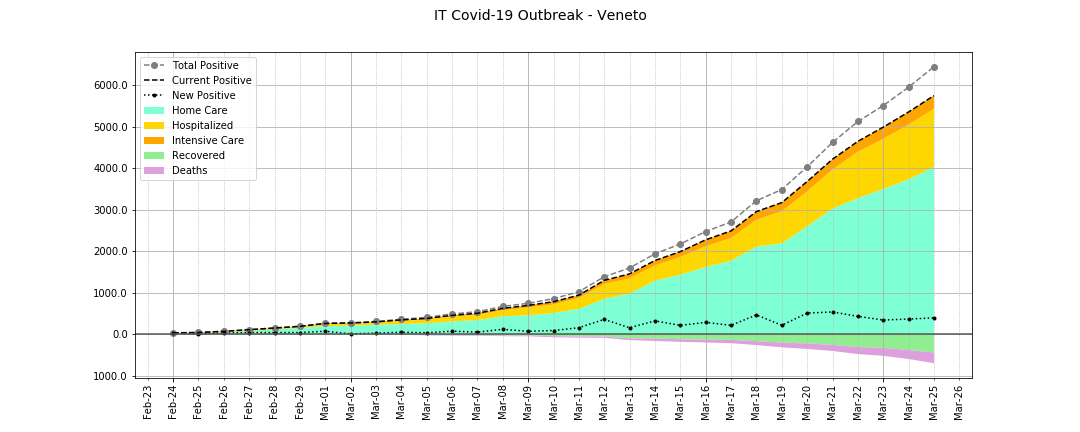
Italy Overall
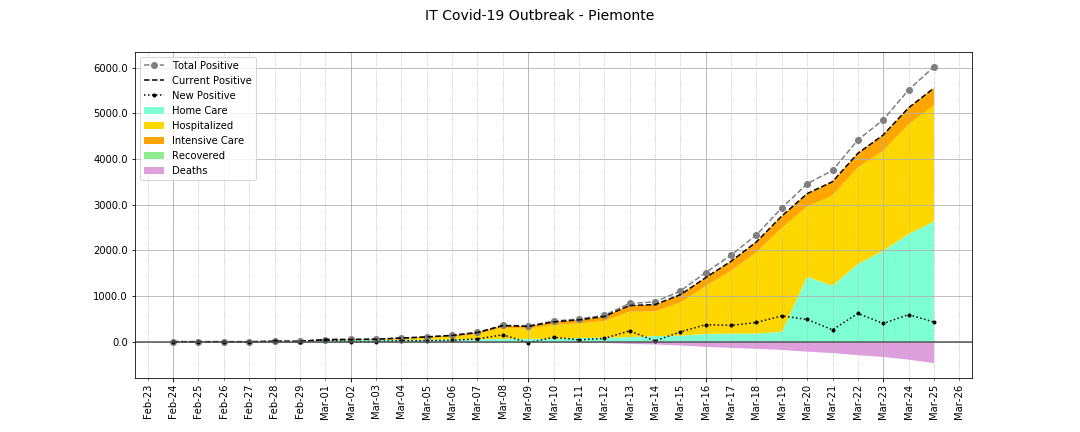
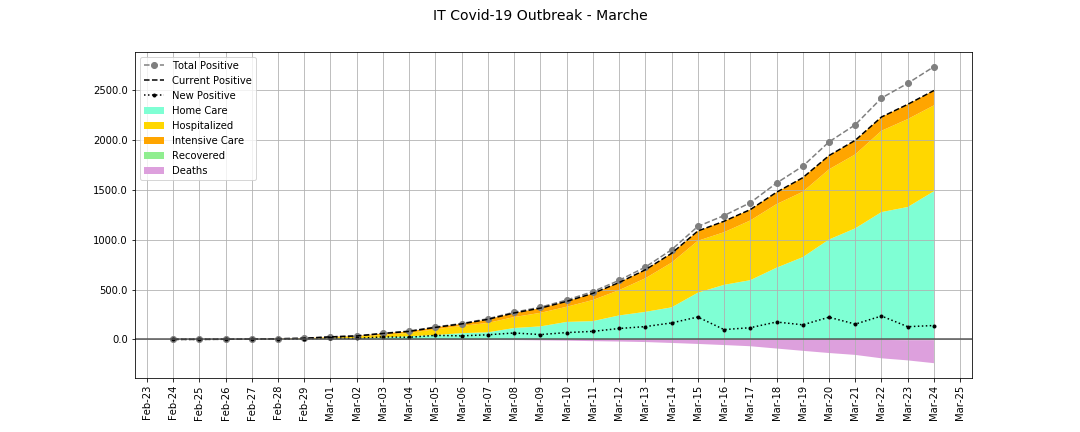
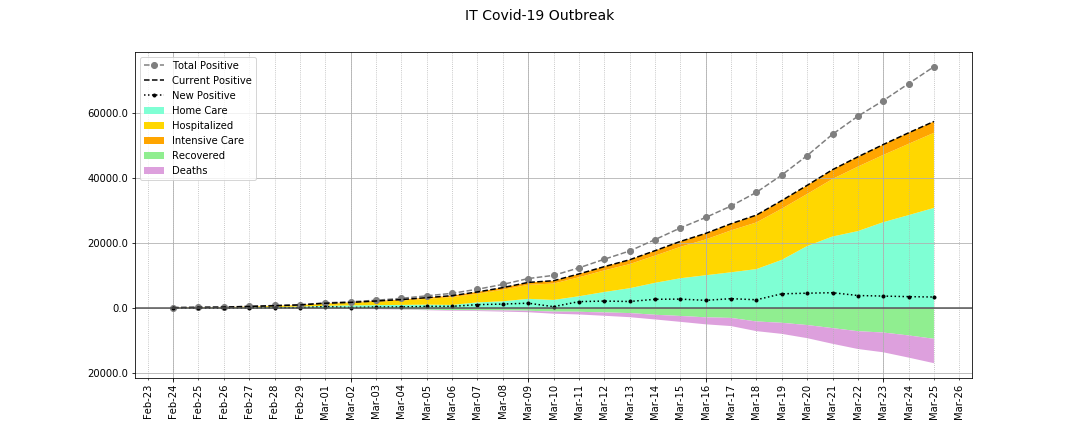
The following graph is intended to provide an overview of trends in Italy.
-
Total Positive:
all cases that tested positive -
Current Positive:
current positive cases are divided into Home Care (home confinement), Hospitalised patients and Intensive Care Unit patients. -
Recovered and Deaths:
both are no longer positive and are plotted below the zero.
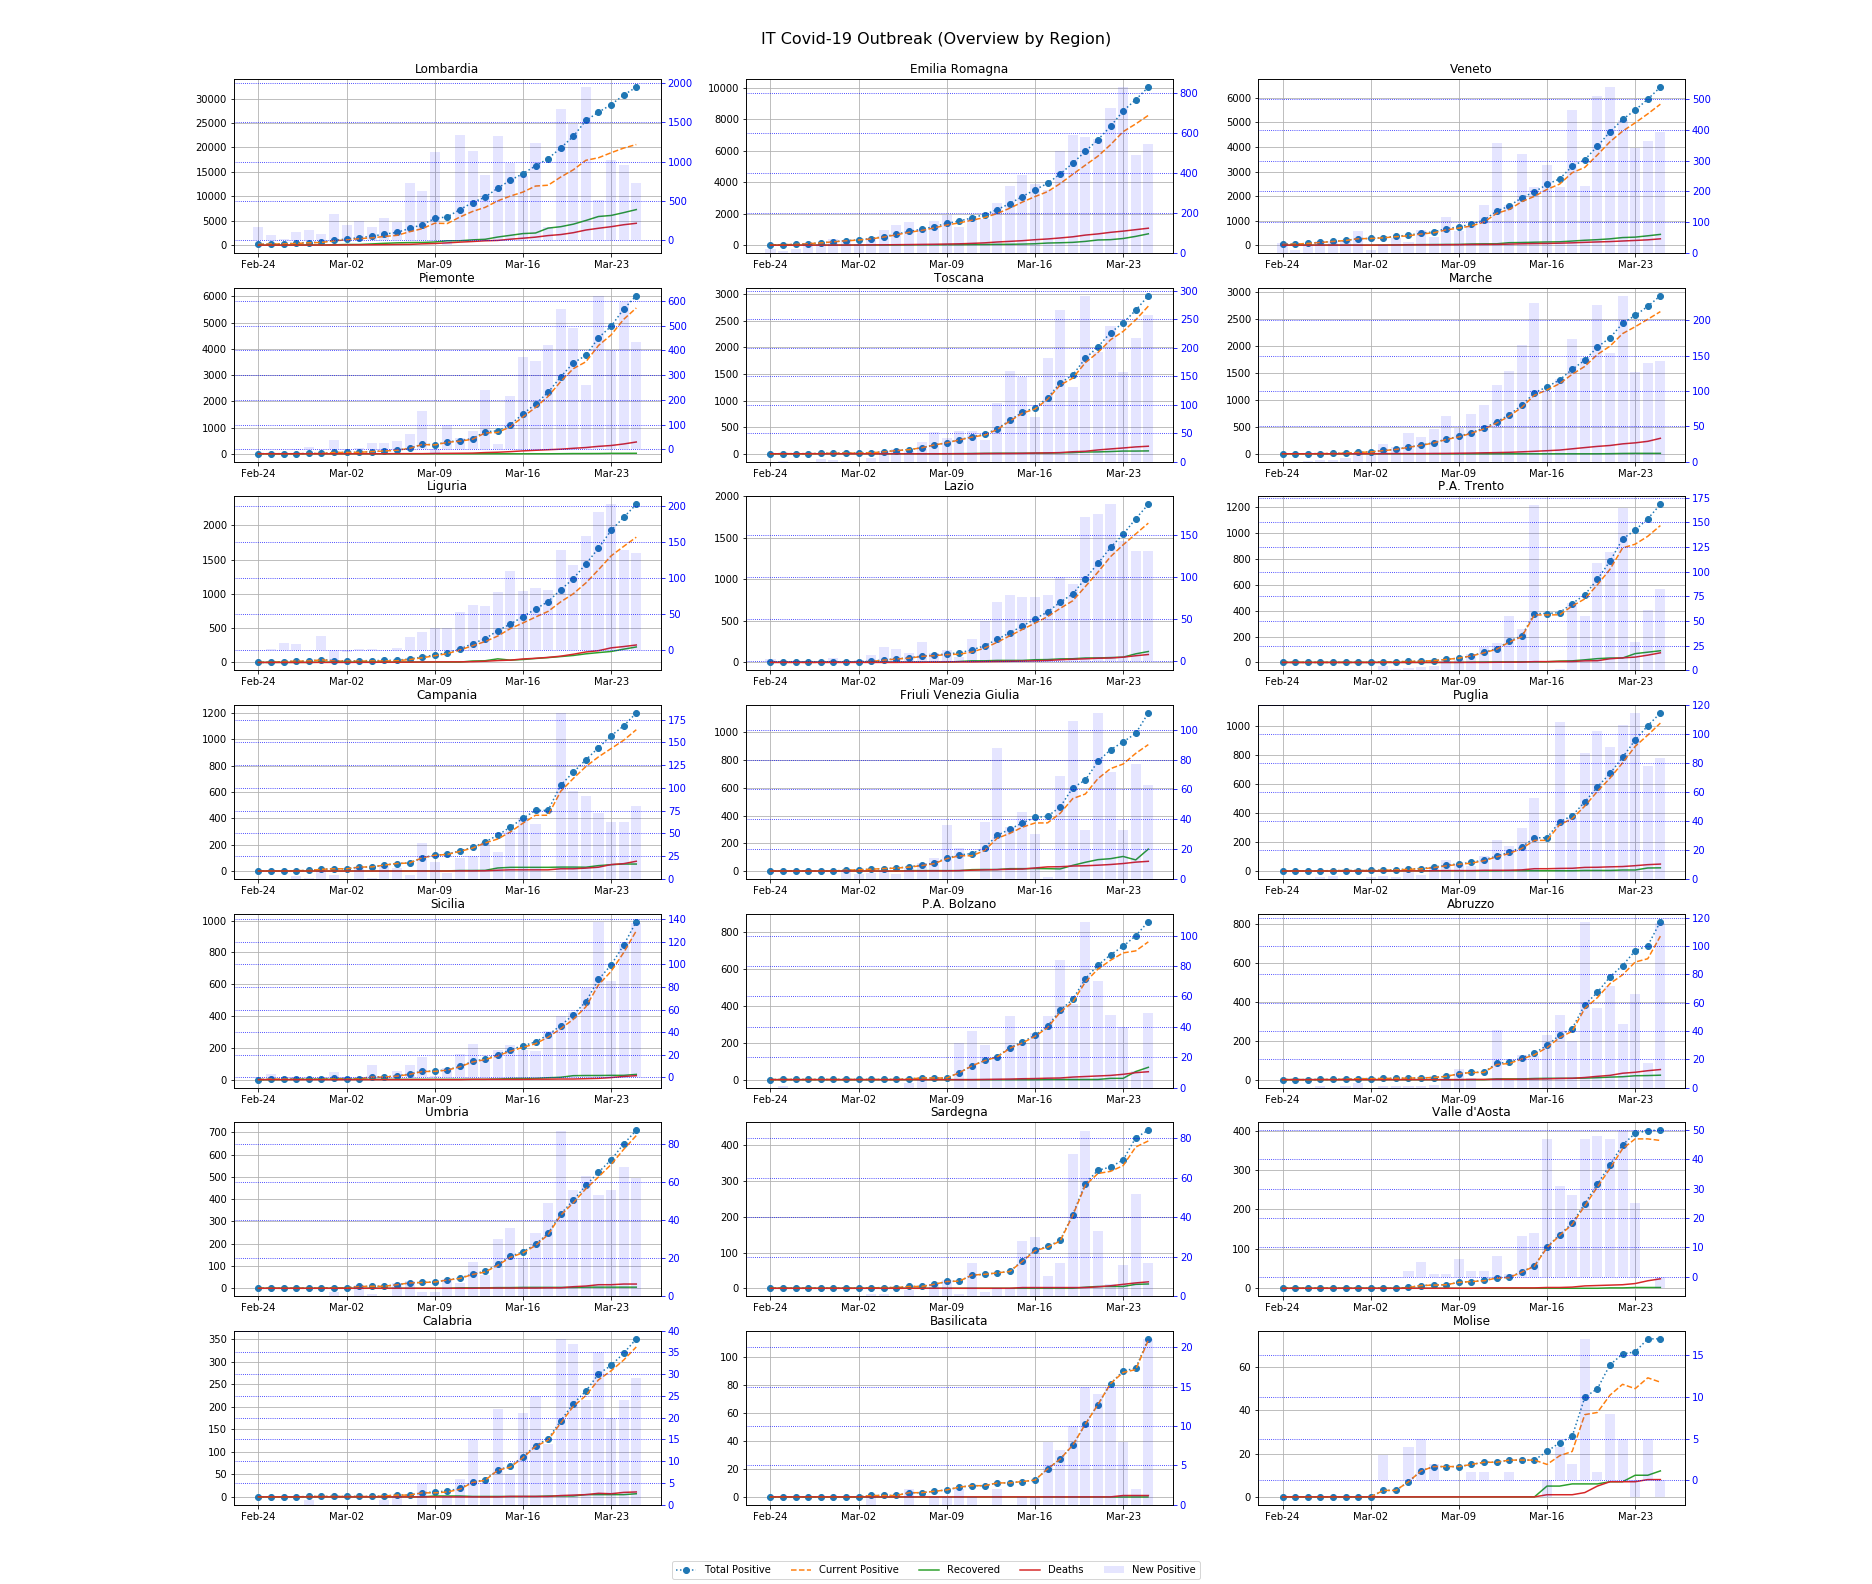
Italy by Region
Warning: Italy is divided into 20 regions, but you will find 21 records per each day in the official data. If you look at columns codice_regione (Code of the Region) and denominazione_regione (Name of the Region), in each day you will find two rows with codice_regione = 4 with a different value for denominazione_regione (P.A. Trento and P.A. Bolzano). This is tricky: Italian Region named Trentino-Alto Adige is divided into two Province (that have a special administrative autonomy and for some reasons they are keeping separate records for data. Do not be confused.
Comparison among Regions in Italy
The pandemic outbreak started in Lombardia and still today most of the cases are in Lombardia. The overall contribution of each Region to Total Positive cases is shown in the following graph:

Same graph above can be plotted for several metrics such as Current Positive, Intensive Care Unit, Recovered or Deaths (I will not post all graphs to save space and time). Lombardia is always leading, but share is not exactly the same: that may suggest some consideration.
Despite Lombardia is always leading, you may notice that percentage contribution has been decreasing over time.
A similar comparison can be made through the following chart (note: I forced the same range in all subplots to ease comparison):
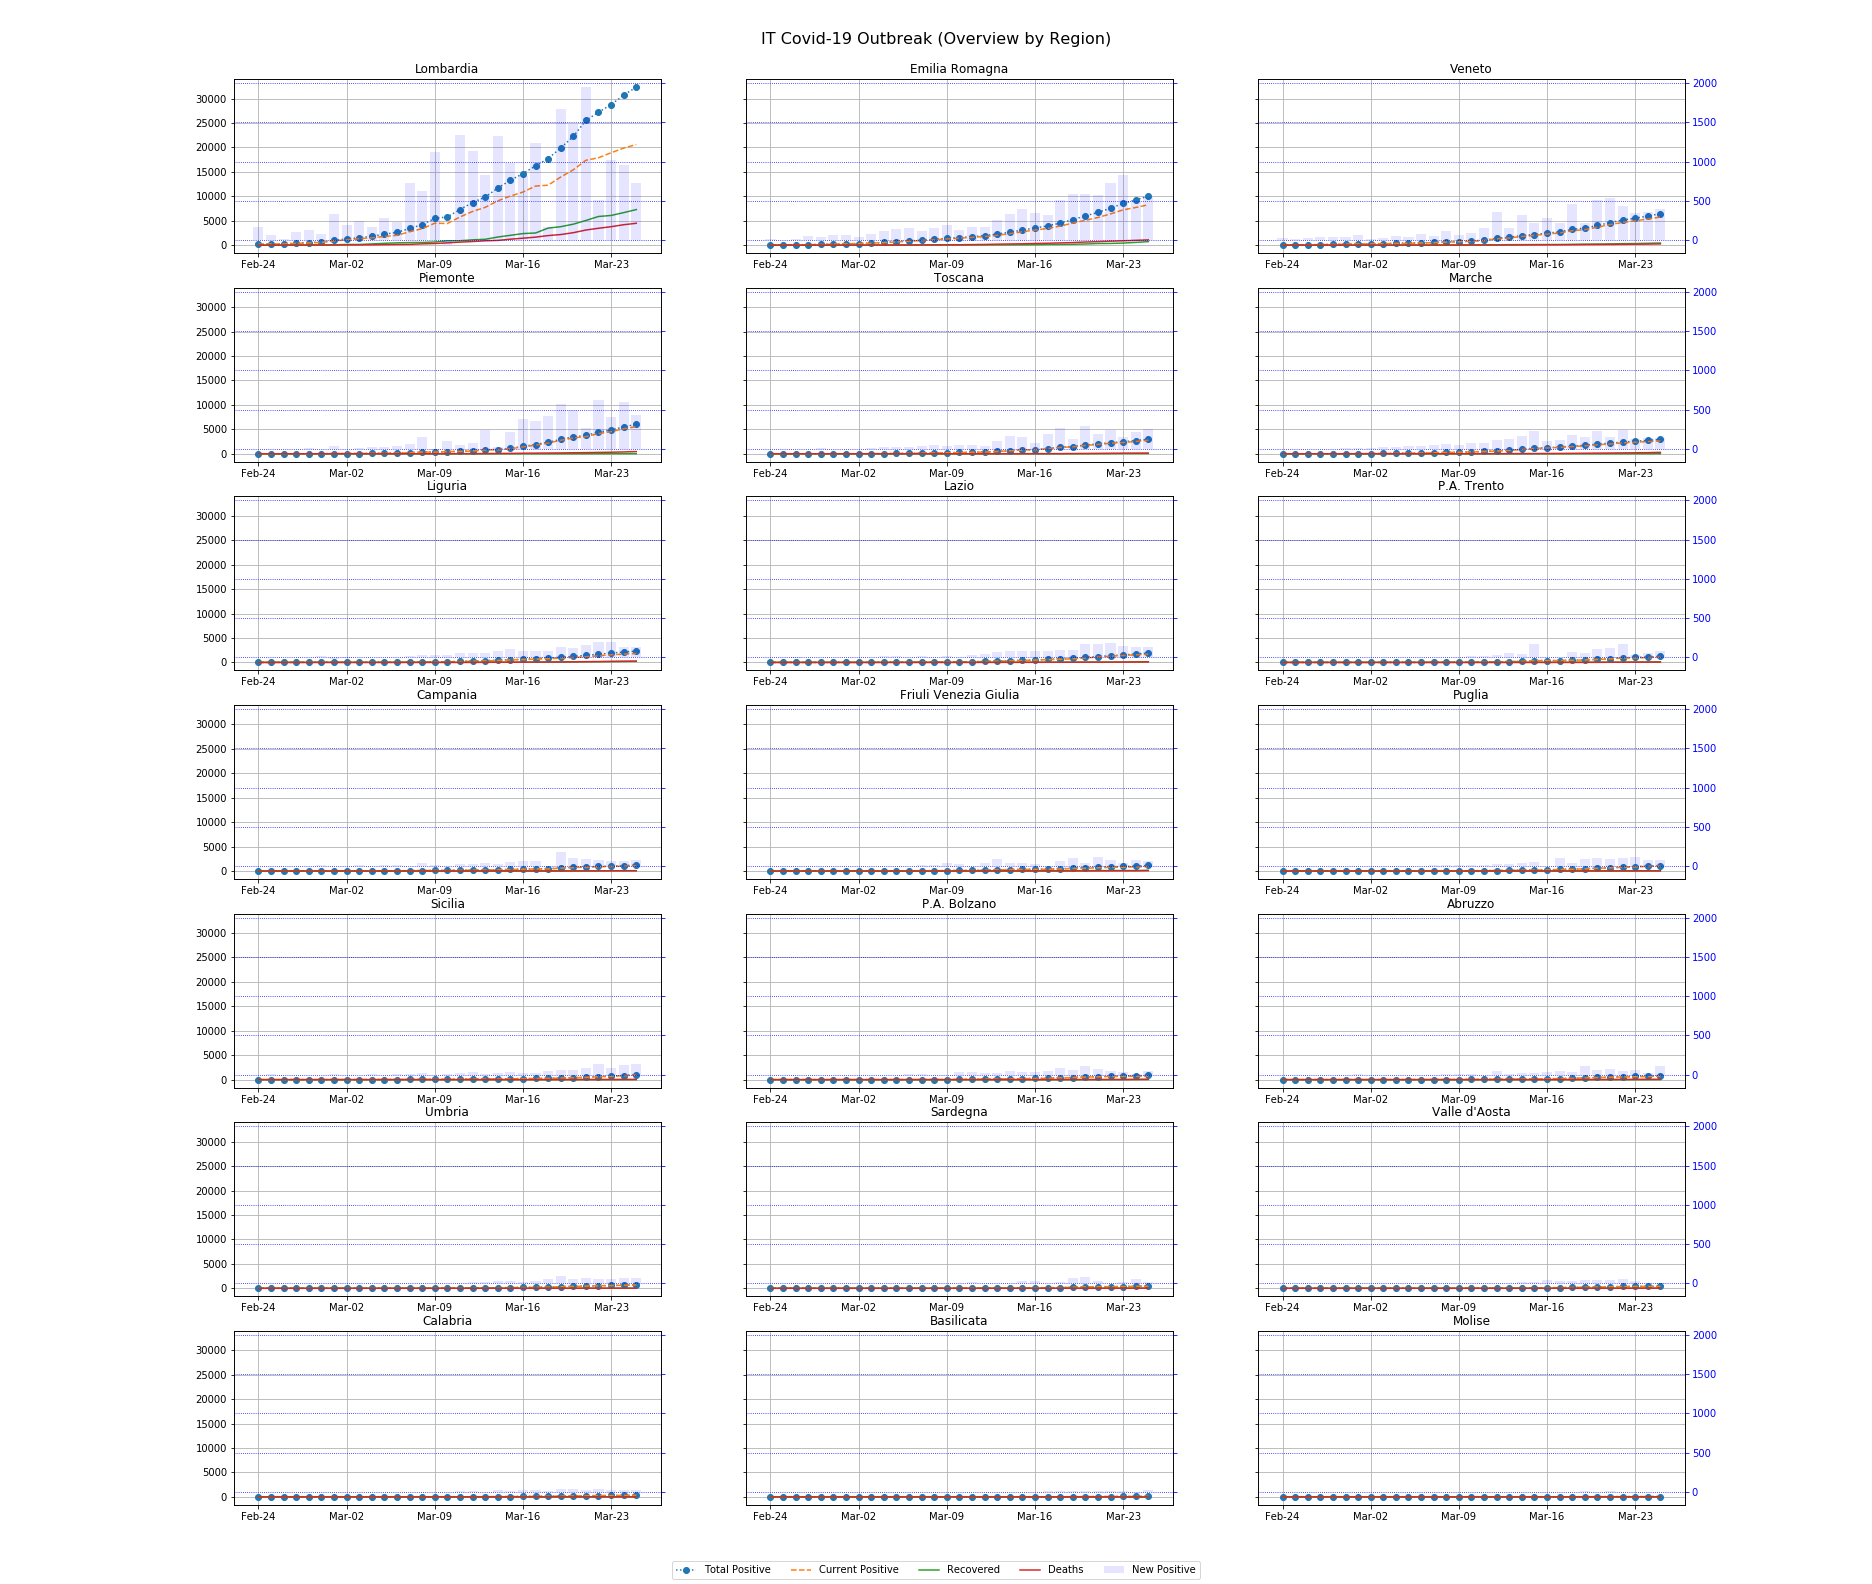
The above chart suggests that, at present, we can focus our attention on 5-6 Regions that are by far the major contributors to overall numbers in Italy.
Anyway, if we remove the constraint we forced above (same range for all subplots), we may better observe the trend in each region.