Interesting read published a week ago, hint: all the graphs are in the appendix / supplemental material.
Key points:
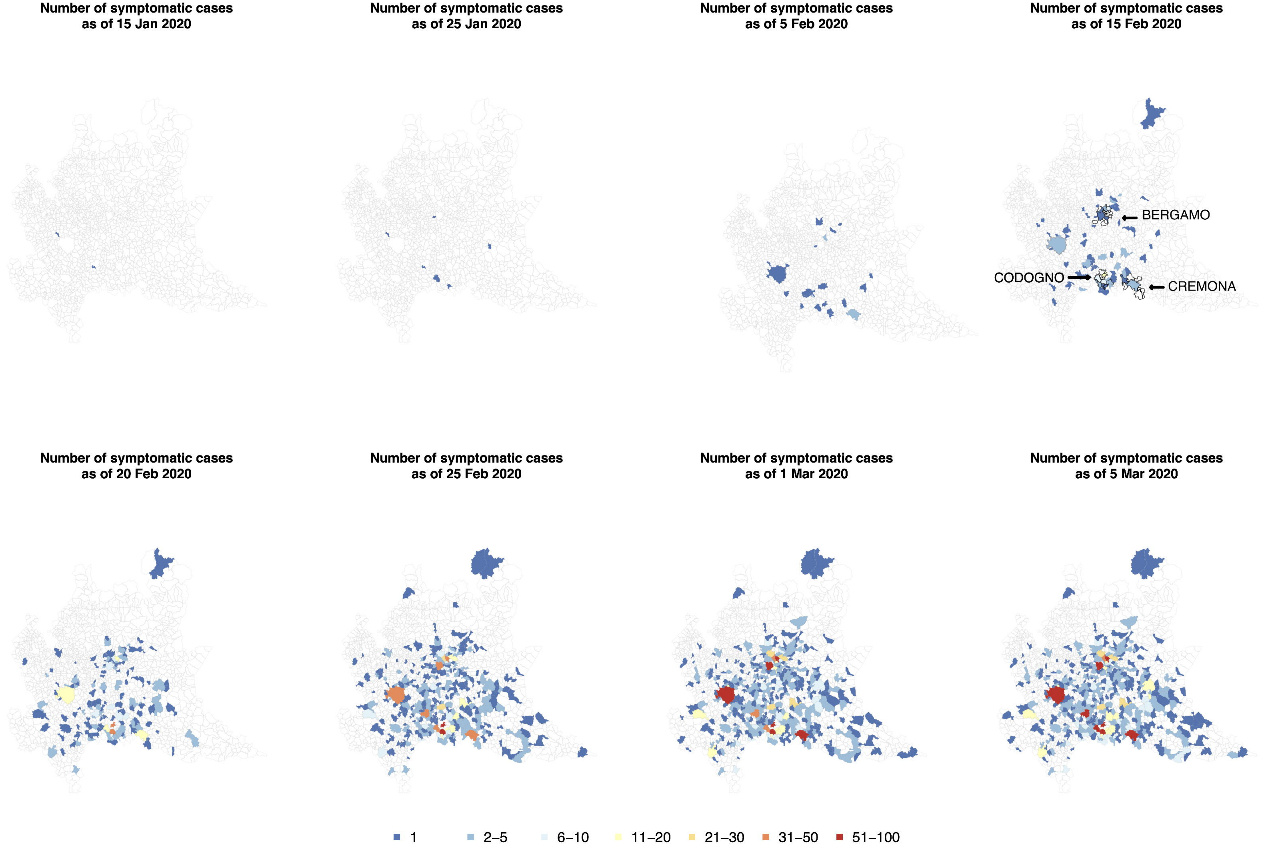
- While the first reported case was on February 20th, and that is where all the official graphs and stats start for Italy, tracing back history and contact chains of the subjects they find that the first onset of symptoms was already at the beginning of January, so the virus was spreading a long time before ever appearing on the map, much earlier than thought. “At the time of detection of the first COVID-19 case, the epidemic had already spread in most municipalities of Southern-Lombardy.”
- Viral loads of symptomatic and asymptomatic subjects are basically the same
- Confirmed what can be found elsewhere too: Extremely high transmission potential
- Also interesting analysis of how the case curves look very different when looking at the official statistics based on detections, or the ones based on symptom onset and even compared to taking into account the different delays between actual test results and reporting in the official statistics.
- Analysis of the R values during the initial outbreak period
- Interesting visualization of the geographical spread of the virus in Lombardy.