Come and learn about your classmates! Data Visualization from self-introduction post

Hey fellows, I thought that it might be interesting to do a word frequency analysis on the self-introductions posted so far. I only processed the raw data in a very rough manner. Here is the result.

WordCloud

The point here is to extract all the nouns from our posts. I thought about parsing each sentence into grammatical structures first and then get the nouns, but that would actually take a long time on my poor little computer. So instead, I just filtered all the words through a noun collection and kept only ones that are longer than 3 letters. As you can see, there are still many words left behind that should have been filtered out, like ‘have’, ‘like’, 'here", etc. Supposedly they also have noun forms.

How could we apply deep learning and NLP technology here to better achieve our goal? Any idea from people who have taken the class before? Sounds super exciting to me.

Some more pictures.

Here are the countries our classmates are from!


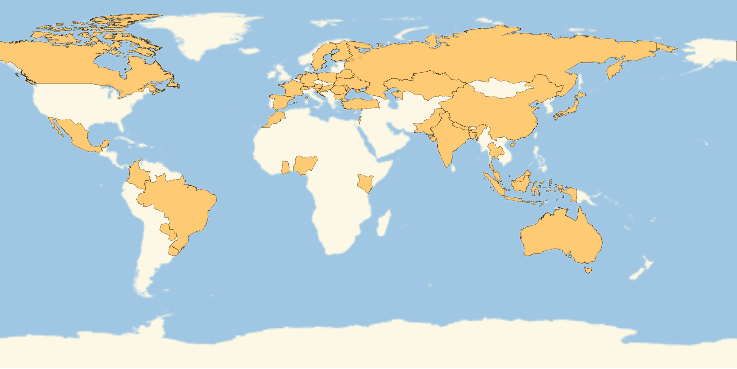
Wow! I am so impressed! We covered every continent except Antarctica. However, this is surely an underestimation, as some people did not mention their country, and the program seems only included countries whose names have only one word. Somehow, USA and UK are not included here.

Any other interesting ideas?

20 Likes

cool!nice work

1 Like

Thanks for the kind word!

Here’s the location of everyone - hopefully someone can make a nice map: https://pastebin.com/Sv0UUmKy

I rounded them off for privacy. And they’ll only be appropriate anyway because of how IP addresses work.

3 Likes

Thanks, Jeremy! Processing structured (lat, log) pair is surely better than doing NLP on hundreds of posts!

Map, based on Jeremy’s file with everyone’s location

16 Likes

Thanks @mrandy - I posted this on Twitter. https://twitter.com/jeremyphoward/status/1051676652772573184

I don’t know your twitter handle so couldn’t credit you, but feel free to reply there so we know who you are! :slight_smile:

2 Likes

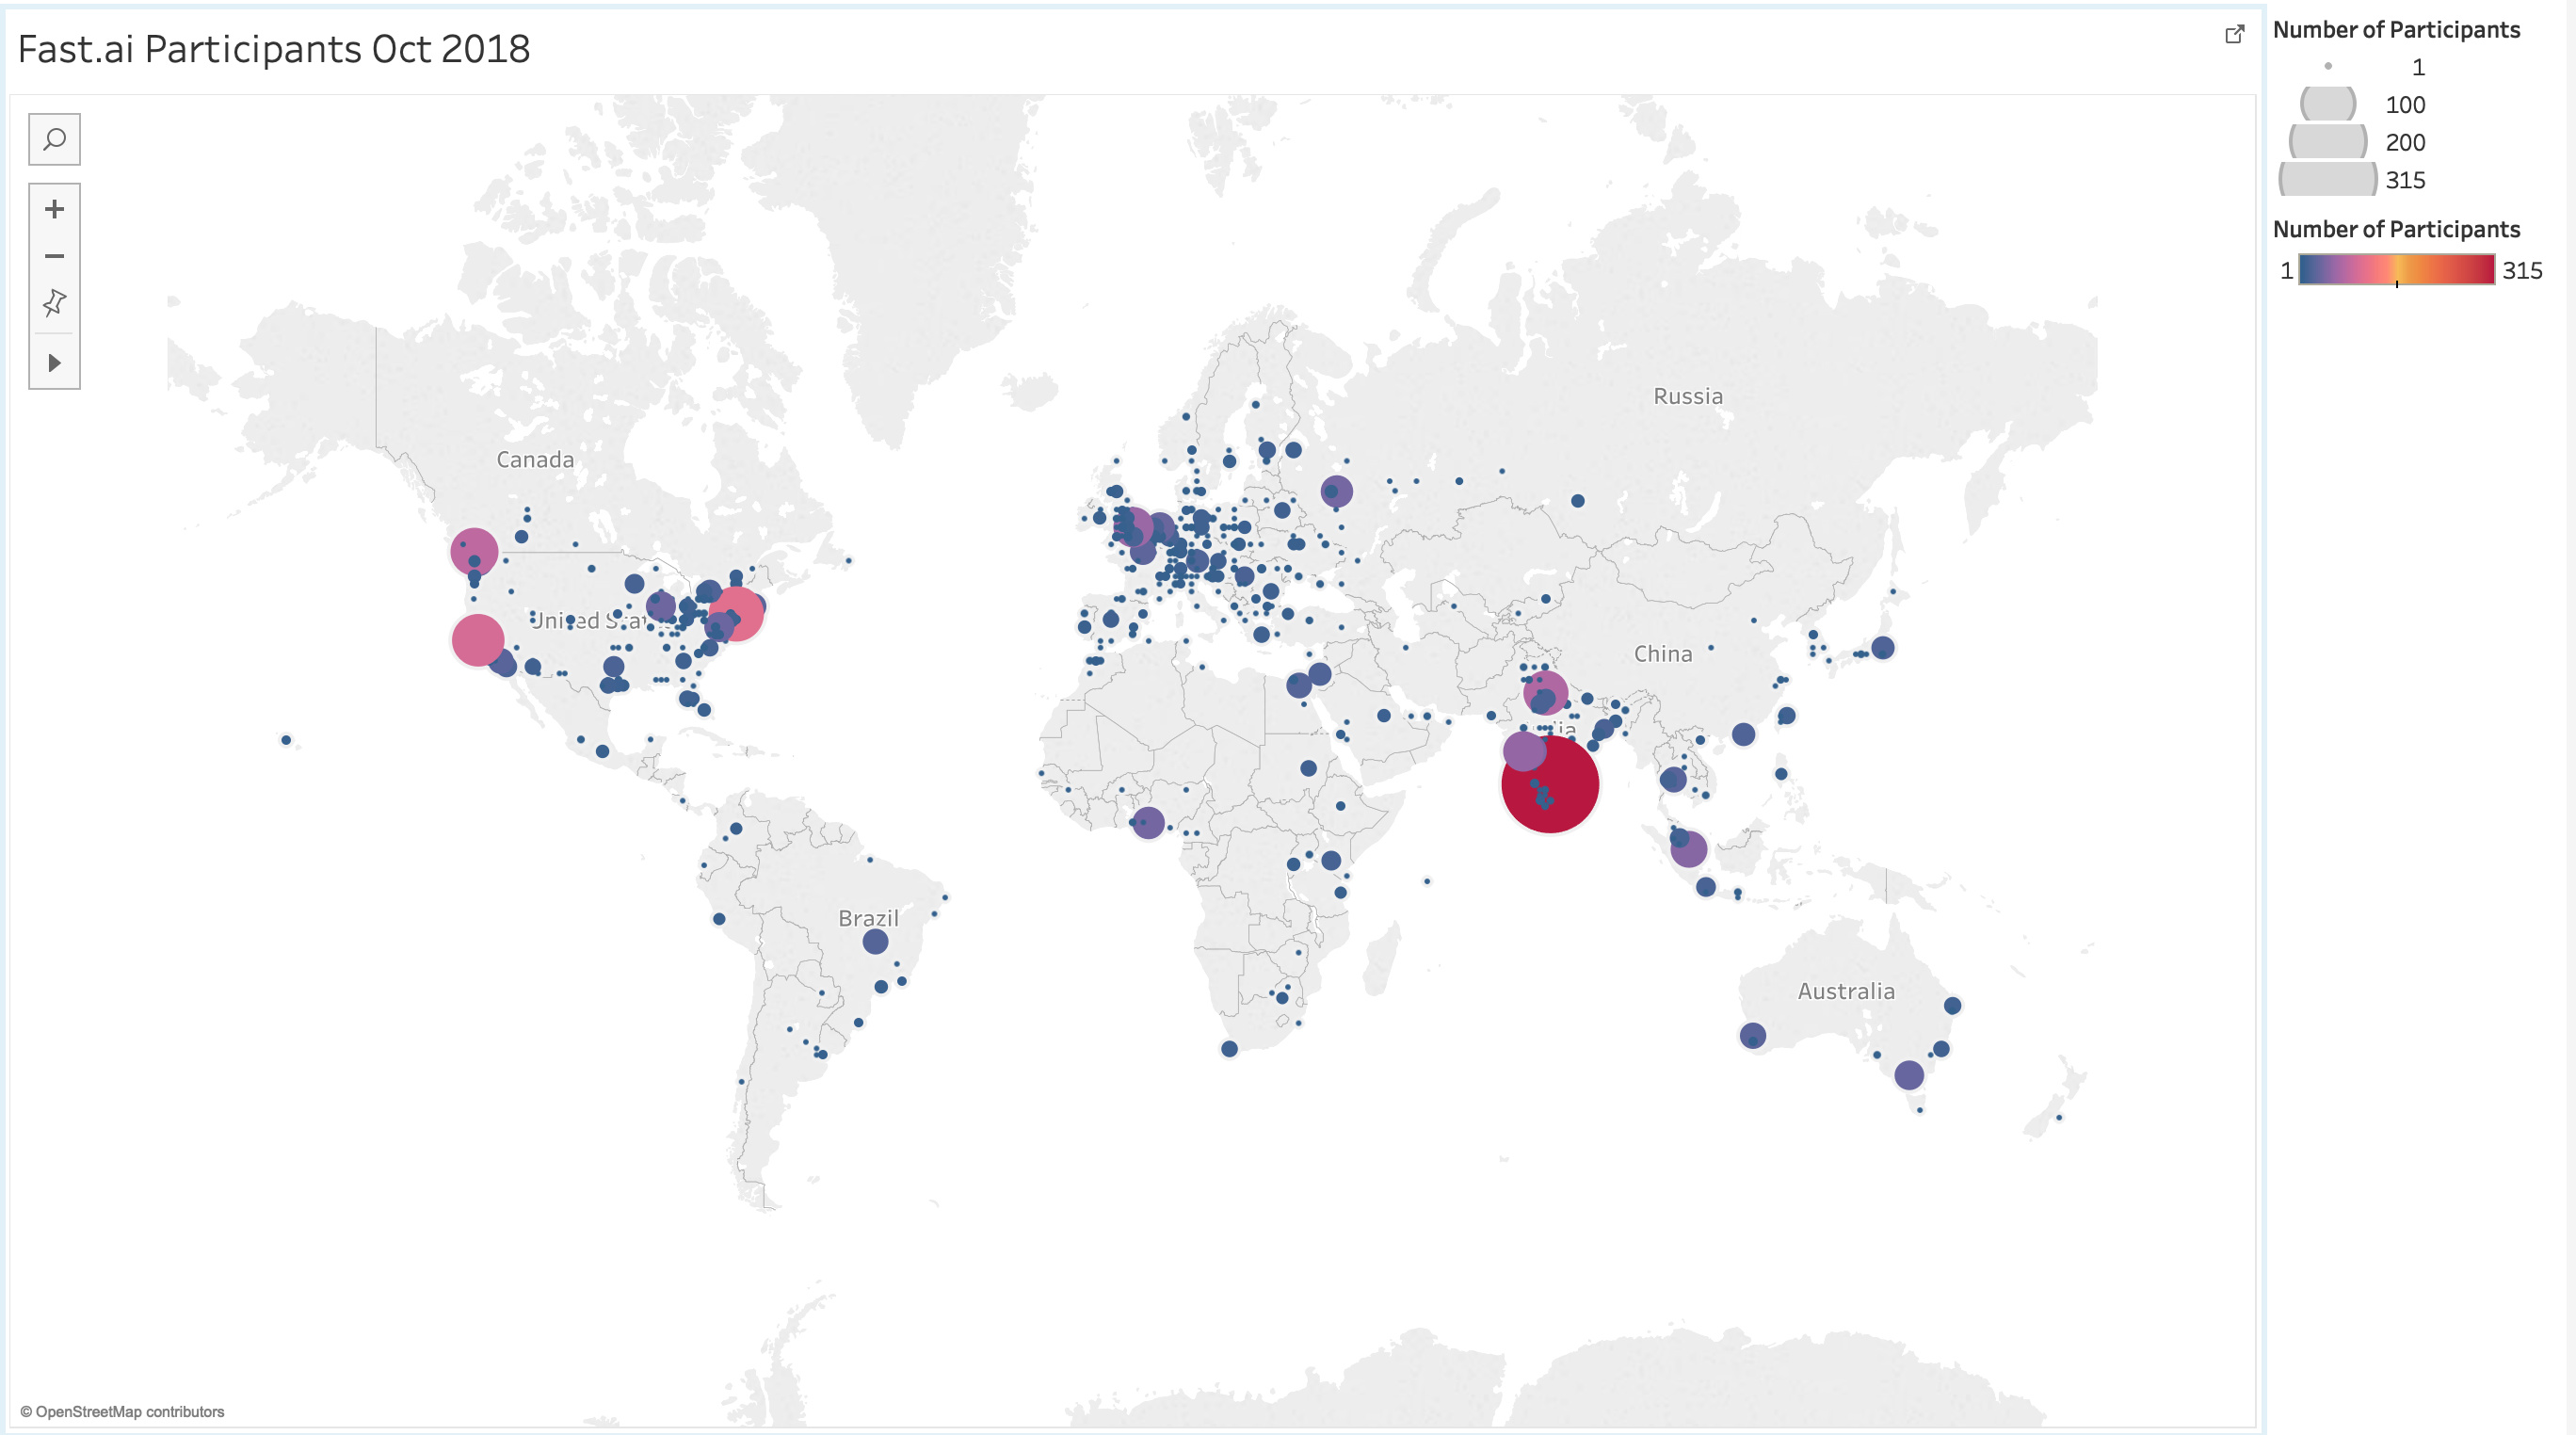
I’m going to guess that tiny little dot on Tasmania means I am presumably the only one here doing the course lol… Really interesting to see, so thanks for sharing.

2 Likes

way to represent!

odd that sydney looks like #4 in Australia

1 Like

Hi Jeremy, would you mind elaborating a bit on the source of the geographic data? Are they from locating IP address? If that is the case, then I can understand why there are so few data points from China, cause they are all using VPN. :joy:

4 Likes

Yeah it’s from MailChimp, where the signup form was. So based on IP address. Sorry for failing to properly account for 中国! 哈哈

1 Like

How can I access the file? Wanted to do some more analysis. Thanks.

Here is the raw data.

1 Like

And here’s the India specific data. If anybody wants any other data, will be happy to share.

1 Like

Here’s another go at a dataviz, using the latitude and longitude data from Jeremy in pastebin.

https://public.tableau.com/profile/alison.davey#!/vizhome/fast_aiPart1v3/Sheet2

The breakdown of participants by sub-region is:

Sub-Region
Northern America 806
Southern Asia 725
Western Europe 237
Eastern Europe 168
Northern Europe 165
South-eastern Asia 126
Sub-Saharan Africa 93
Latin America and the Caribbean 85
Australia and New Zealand 81
Eastern Asia 74
Southern Europe 66
Northern Africa 46
Western Asia 44
Central Asia 5
Total 2721
8 Likes

Guys, that settles it. We need someone to move to Antarctica to take the course.

Well, we need to first find an IP address that is located in Antarctica.

3 Likes

Hey Alison, the map looks awesome. Would you mind sharing the Tableau workout with the class? I would love to learn how to make a map as good as this one.

1 Like

Hi George

Thanks, I’m thrilled that you like the map.

The data preparation was more challenging than the Tableau part. I have put everything into a notebook https://nbviewer.jupyter.org/gist/AlisonDavey/bef98362f4e442b340ed0a05ead43b91

You can also download the Tableau workbook from the web page.

3 Likes

Thanks @AlisonDavey! FYI, here’s the best way I know to share notebooks like that: https://jupyter-contrib-nbextensions.readthedocs.io/en/latest/nbextensions/gist_it/readme.html

2 Likes