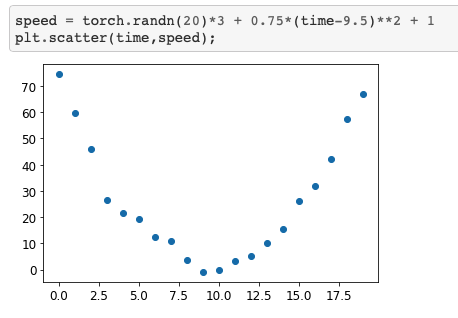
In Stochastic Gradient Descent (SGD) section there is example where we want to measure the speed of a roller coaster every second for 20 seconds. Authors use this mathematical equation as the basis:
Hmm… you mean a parabolic curve relates to variable speed: higher, high, lower, low and zero speed at different times. Speed variation of such type can’t be represented by a straight line. Am I correct?
It is just a learning example. The point of the exercise is to show that SGD can be used for approximations of curves.
More complicated shapes can be approximated too, and that is literally what deep learning is about (though every input can only produce one output, so Z shapes can not be approximated and your rollercoaster image wouldn’t work either). However, approximating more complicated shapes requires more complicated functions. How this can be done is described in the follow up lectures.