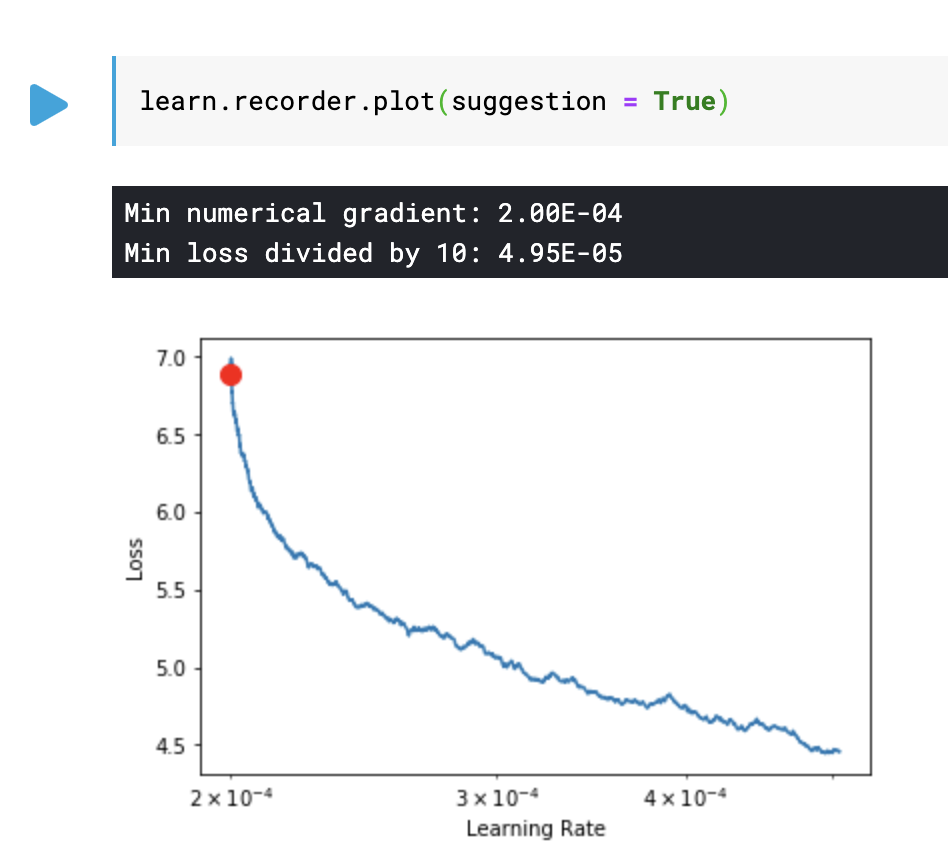
I ran a different data set using the dog/cat lesson as my benchmark. When I ran the learning rate recorder plot I got the following image below. What would you set the LR for and what would you set for something like this for example:
learn.fit_one_cycle(5, slice(lr))
Hi CharlieC,
not enough here to really help you.
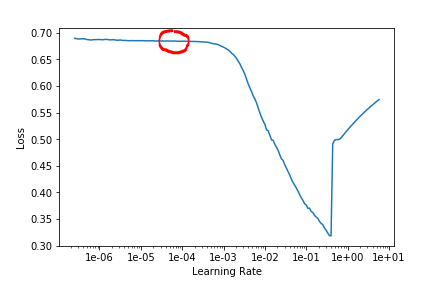
your plot is only showing a not very useful scale on the x axis, effectively the red circle
we don’t have your code to see why that is so
The plot function takes in mor parameters like skip_end. That will give you more points to plot and maybe you could play around with that and see if you can see if the plot shows where the loss starts increasing.