As a member of the time series/ sequential data study group, I’d like to share with all of you an initiative the group have agreed to launch. It’s a Time Series Learning Competition!
Unlike traditional Kaggle competitions, the main goal of a learning competition is learn and share our knowledge within the fastai community by fostering collaboration.
We believe that by focusing our work on the same dataset, we’ll be able to learn and share our knowledge with the rest in a very practical way.
As an initial dataset, we have agreed to take the Earthquakes dataset (from the UCR time series dataset).
It’s a relatively simple dataset (since this is our first ts learning competition). This is a univariate, binary classification problem. It has 322 train and 139 test samples, with a length of 512 steps. If you use the link above, you’ll be able to read a brief description of the dataset.
According to the UCR website, the current state of the art accuracy is 75.92% (Rotation Forest). Will we be able to beat that while we learn together?
Learning competition rules:
The objective of the competition is to learn as much as possible and share that knowledge with the rest. The performance (in this case val accuracy) will obviously help us gauge the value of different proposed approaches, but it’s not the main driver for this competition. If you find a post interesting/ useful, please use the button to indicate it. This is a good way to measure each participant’s contribution to the thread. At the end of the competition we’ll have a contributors’ leaderboard.
We will openly share ideas, provide feedback to others, and will upload our notebooks to a shared time series repository created for this learning competition (repo).
Deadline: by end of the course, although we can extend it if you are interested.
Ideas, feedback, performance results for this competition should be shared in this thread.
There won’t be any test set or formal submission process. Just create a notebook gist it, write a post in this thread, and share your notebook/ gist with your results (if you have any idea how to do this more efficiently just let us know).
You can use any technical approaches to this problem (deep learning or not, fastai or not).
Award: learning , the feeling of contribution , … Ideas? Any sponsor?
If you have any questions, please don’t hesitate to post your question in the forum!
We look forward to having you participate in this competition. Thanks!
Great initiative! I was in a fix where to start with Time series, and whether I was doing good enough. With several people working on same data, it would be a great learning experience. Godspeed!
The TSSG has created a notebook to help you get started with this problem.
There’s no need to use it. It just may be helpful for some people to get data already prepared.
You can find it here.
Looking forward to getting the first posts!
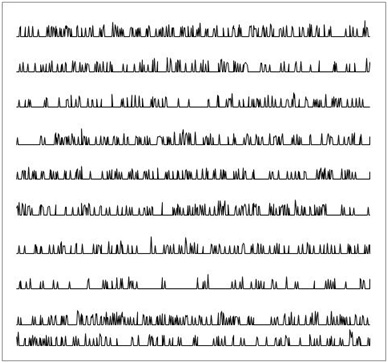
Hi all, similar to @oguiza i’ve uploaded a notebook which with some helper functions that can prep the data into a dataframe (for classical/rnn type approach) and also transform the data and save the images for a CNN-type approach as suggested @oguiza in this post, as well as some aid in visualizations in case you would like to experiment with that. Hope you guys find it helpful!
So, here is a baseline for the competition : Accuracy 0.748
I wanted to play around with the tabular model with block api, as I had not done that before. This dataset of course is not ideal for that, but I got it working and get consistent accuracy of 0.748201. This number comes up no matter how deep/wide the architecture and after fiddling with the hps a bit. It always seems to converge on this (I had one freakvalue of 78.4% but that seemed random and not reproducible.
Have a look:
BTW: I have used the TEST file as validation set, because the number of examples in total is very limited. So training a naked neural net with this is actually not ideal. So I am looking forward to seeing better results with CNN approaches! Let’s go! Beat me!
This is a terrific baseline, thanks Marc. I have a couple of quick questions, please:
You have only used one epoch. Why is that? Is it perhaps because there are so few examples that you may rapidly start overfitting? (It does feel like the tabular DNN model approach may struggle with so little data.)
Why did you choose a learning rate of 1e-2? Judging by your plot the loss seems to be already increasing again by then. FWIW, I think I would have chosen 1e-3!?
Thanks @marcmuc for daring to kic off this learning competition!
Yes, you right. In this competition there’s only train and test datasets. But it’s the same dataset used in many time series publications, so I guess this is the approach they use.
Something I like to do with any dataset is to look at the label distribution. In this case it’s very important since this is a pretty imabalanced dataset.
These are the stats:
train set:
class 0: 0.8198757763975155
class 1: 0.18012422360248448
test set:
class 0: 0.7482014388489209
class 1: 0.2517985611510791
So we now know where the 0.748201 comes from @marcmuc.
If you use the model interpretation I’d bet all predictions are probably 1s.
Having said that you are still at the top of the leaderboard!!
so a complete bullshit submission. Kinda like those kaggle competitions where an all zeros submission still lands you in the middle of the leaderboard somewhere. Thanks for pointing out this obvious flaw, we are here to learn, right?,
I would like to reply to this with my new life philosophy (c) Jeremy Howard Lesson 5:
The answer to the question “Should I do blah?” is always: “Do blah - and see!”
Seeing as an epoch in this case runs within 0.1 seconds, I tried several architectures (num and size of layers), all kinds of learning rates, batch sizes, all kinds of weight decay, in the end I chose what gave me the convergence result within the least amount of epochs. So this choice was not based on the lr finder but on experimentation. Based on the lr finder I would use what you suggested too. And generally I would tend to use only as few epochs as neccessary, because the risk of overfitting is smaller the fewer times the model sees the same data.
But in this case all models using all kinds of different hyperparameters eventually converged on the same accuracy.
And as @oguiza has pointed out above, the reason they all converge at the same number is because probably they simply all end up predicting just ones, which gives the result of the class balance of the test set as accurancy, showing that what I did there was anything but good. But to be honest it also was just a toy example… But, maybe now we can try to use other loss functions that deal better with the imbalance and penalize this model behaviour somehow or other interesting things, so I guess it was still worth something
One central learning here should probably be that the metric is kind of useless, I will try to see whether different f scores will show this more clearly…
But I’m glad you made that submission. It made me think the following:
I know understand why they do this in Kaggle. I guess it’s a simple wasy to know if the label distribution in the test set is similar or very different to the val set. If you learn the test set in imbalanced, you may want to apply a different approach.
In real life, we don’t know what the real test set (future data) will bring. So I guess it’s important to understant the variability you have in your historical data to see if you may need to use techniques to manage imbalance.
I’ve check a couple of papers on this dataset, and the metric they use is accuracy.
Hi guys! I’m about to sit down for a couple hours before the holiday and crack down on this dataset, here’s my baseline as of one run with a GADF encoded image, size 128x128, and doing the usual set of epochs with the resnet frozen, unfreeze, then a few more epochs:
i have been working with this issue for 1.5 months now on another dataset (mammopgraphie). I finally started having some succes ( not complete) by weighing the crossentropy by the inverse of the distribution
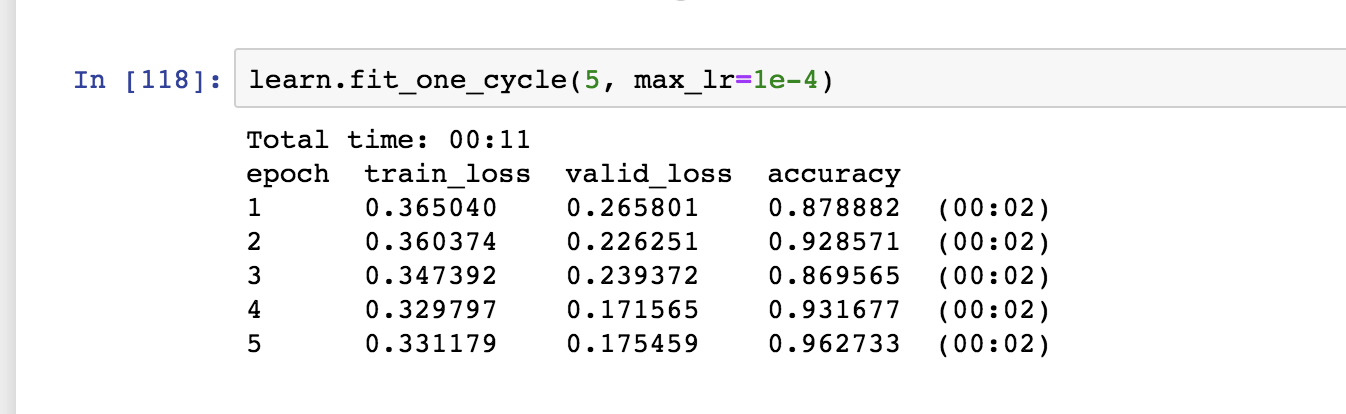
I have finished implementing the multi-image classifier and have tried with 3 images (GADF, MTF, RP) also in one go, results is >96%! Will download and post the notebook so you guys can take a look. Next I will (finally) implement the wavelet encoder so I think it will get even better then.
Here is the link to the notebook, mind that the architecture I used was “multi_image_classifier_2” (defined at the bottom), for whatever reason the first go which uses the same code as fastai’s “create-head” was throwing errors so I figured I could do without batchnorm. Will keep you guys updated as I add more things in!
edit: i realize in my classifier head I didn’t even include ReLU the first time … but weirdly when I put it in it doesnt seem to help (the highest I get with ReLU is 93%) any idea why that might be?
I have not been able to repeat 96.2 on reruns of same parameters, ; I consistently get >90 and have seen 93.8 again without changing setting. At least I have save the model lol. Will try again for a few and if not will take it a lucky initialization and move into further experimenting to see how adding image size and other images can help.
edit: have hit 97.5% with same parameters on a run (and save model) except making the fit_one_cycle go to 10 epoch instead of 5. I will save this and take some time off to mess with other things hope to see other people use the notebook to reproduce but please keep in mind it took me ~30 tries of re-instantiate model and train, only 4 of which exceed 93%. not sure what the deal is with the variance here…
edit2: results are consistently reproducable, I made the mistake of adding relu after I noticed it was missing, running LR_find and setting LR too low, then i re-read the notebook i posted and saw it was 10e-4, when i reset it to that i am getting consistently 96+, around a third of the time i hit 100% (with again, as mentioned the one_cycle is set to 10 epochs not 5 as in notebook, otherwise everything the same!)
 button to indicate it. This is a good way to measure each participant’s contribution to the thread. At the end of the competition we’ll have a contributors’ leaderboard.
 , the feeling of contribution
  , … Ideas? Any sponsor?
 : Accuracy 0.748

 so a complete bullshit submission. Kinda like those kaggle competitions where an all zeros submission still lands you in the middle of the leaderboard somewhere. Thanks for pointing out this obvious flaw, we are here to learn, right?,
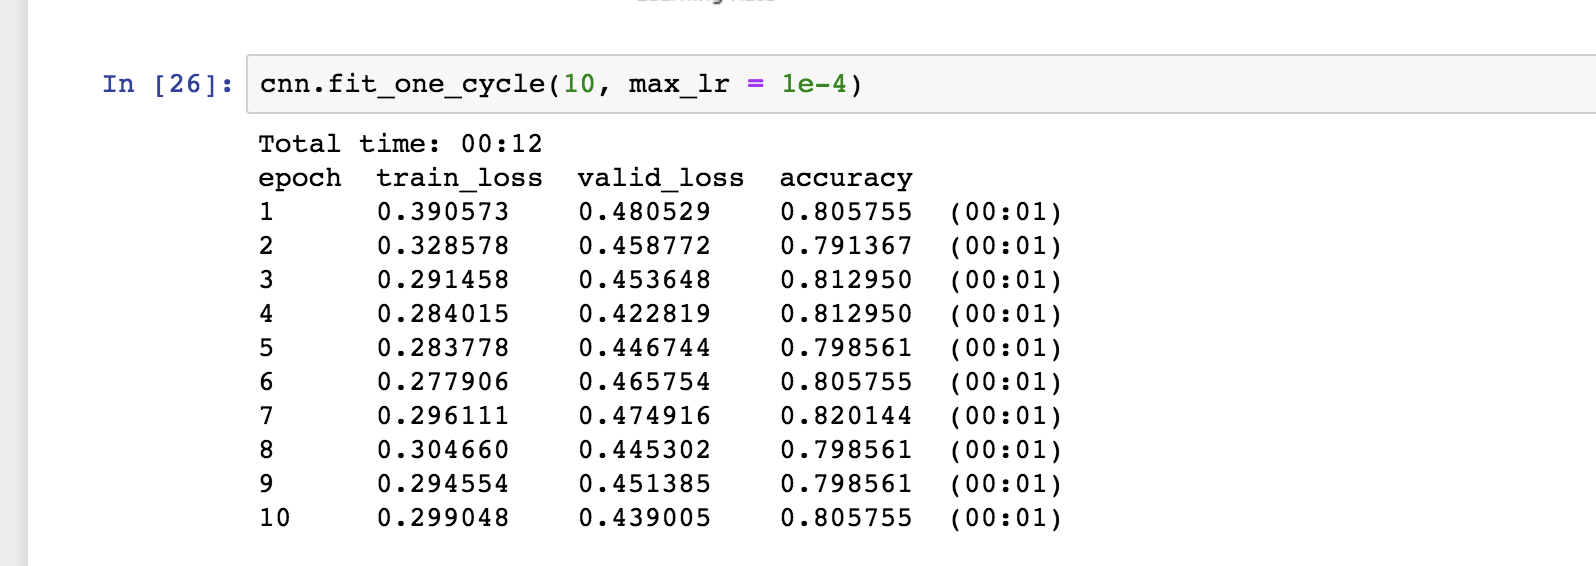
 ; I consistently get >90 and have seen 93.8 again without changing setting. At least I have save the model lol. Will try again for a few and if not will take it a lucky initialization and move into further experimenting to see how adding image size and other images can help.