Unjust bias is an increasingly discussed issue in machine learning and has even spawned its own field as the primary focus of Fairness, Accountability, and Transparency (FAT*). We will go beyond a surface-level discussion and cover questions of how fairness is defined, different types of bias, steps towards mitigating it, and complicating factors.
I will post some of the links mentioned in class (and will add more as I remember them). Feel free to ask if there was a link/reference mentioned that I’ve forgotten to include.
4 Principles for Responsible Government Use of Technology: this is a post I wrote recently (based on our CADE Tech Policy Workshop) related to government & police use of technology. Related issues came up at several points in the discussion tonight.
Racial categories in machine learning: “This creates a dilemma for society and designers: be blind to racial group disparities and thereby reify racialized social inequality by no longer measuring systemic inequality, or be conscious of racial categories in a way that itself reifies race. We propose a third option. By preceding group fairness interventions with unsupervised learning to dynamically detect patterns of segregation, machine learning systems can mitigate the root cause of social disparities, social segregation and stratification, without further anchoring status categories of disadvantage.”
Sharing a couple of links I ought to have remembered earlier, but brains are hard:
Diversity in AI is not your problem, it’s hers by Robert Munro (article): A really in-depth example of gender bias in a dataset that gets extremely specific as to which vectors the bias did and didn’t enter on.
Corpora as medium: on the work of curating a poetic textual dataset by Everest Pipkin (video, 23 minutes): Not precisely germane to the themes of the class, but I found this to be a really touching presentation about the importance of intimately selecting and engaging with your data instead of just grabbing whatever you can.
Also, I mentioned one example of an interesting compound bias to Rachel after class and she encouraged me to share it with everyone. The healthcare industry in the US is gradually shifting from fee for service (where insurance reimburses for each individual service rendered) to value-based care (where insurance pays a flat yearly amount for health systems to keep people healthy). There are endless complications on top of it, but the base movement is a good thing, aligning health systems incentives with the patient’s (since preventative care is both cheaper and better for the patient’s health).
However, a one-size fits all reimbursement can be a problem when some places just have sicker patients than others. This leads most places to do risk adjustment payments. How do you adjust for risk? You use a risk score like HCC, which takes patient diagnoses as inputs. Now, in fee-for-service land, diagnoses are mostly only needed to justify procedures - you code a broken arm diagnosis to justify the surgery. But there are a lot of diagnoses that don’t often lead directly to procedures, and that a doctor has a large amount of latitude when deciding to discretely code or not - depression, anxiety, things like that.
The key here is that you don’t have a financial incentive to document depression in a fee for service system, but you do when you switch to value-based reimbursement, because it will raise the patients risk score. So when people are studying the “increased incident of depression” in the US over time, they might actually just be studying the improved coding of depression as it becomes profitable for increasing segments of the country to write it down. This is both a observation bias and a historical bias, and one you can’t control for cleanly, since different health systems are going to value-based at different times. It’s a really stark example of how some things will *never be detectable without a ground level knowledge of the data that’s actually going in - algorithms alone will never save you.
Hi @erinjerri, I just created the week 3 thread. I’ve swapped weeks 4 & 5 from what I originally shared, but both the Google doc and the forum post versions of the syllabus are up-to-date.
Michael Krasny had an interesting discussion yesterday morning on KQED’s Forum program with Anna Wiener, author of the new book ‘Uncanny Valley.’ The theme of bias in Silicon Valley was central to the discussion and there were some interesting comments from callers. This doesn’t pertain specifically to data ethics but would probably be of interest to some here: Anna Wiener Reflects on Silicon Valley’s Dark Side in ‘Uncanny Valley’
We just got our book yesterday and it looks very interesting! My husband and I are collaborating on a conference paper about first time founding as a rite of passage for startup founders in Silicon Valley. One of the things we’re most keen to explore is how there’s a secondary rite at play—which is how failure also helps many founders shed the appearance that privilege could be responsible for their success. Wiener’s discussion of the myth of meritocracy is helpful.
I really learned a lot for week 2. I thoroughly enjoyed the readings. Here is an interesting article from Vanity Fair on President Trump feuding with climate activist Greta Thunberg on Twitter. The bias of the President against Greta is blazingly apparent as he can’t control his angry tweets towards her. This shows how Twitter has become a social media platform for bias and bullying on a prominent national level.
Here’s another interesting NPR article about a new book–Susan Fowler’s memoir, which discusses discrimination, bias, and ethics in Silicon Valley: Uber Whistleblower Takes on Silicon Valley, Armed With Stoic Philosophy I appreciate the quote at the end: “Uber didn’t just need more women engineers, or more employees of color,” she writes. “It needed to stop breaking the law … It didn’t matter how many black engineers we hired, if they were discriminated against; it didn’t matter how many women we put into positions of power, if those women perpetrated or enabled the illegal behavior.”
Thanks for the great suggestions and references! Here is another one that I found interesting: Fairness and Abstraction in Sociotechnical Systems, 2019 ACM Conference on Fairness, Accountability, and Transparency (FAT*), 59-68.
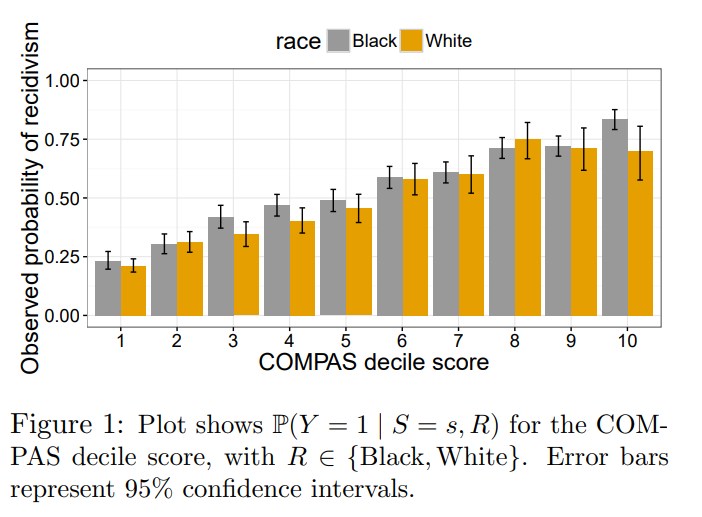
This is a key chart illustrating the definition (described in the paper as “test fairness”) that COMPAS uses. Here, for each score (1-10) assigned, people are similarly likely of being arrested again. That is, someone with a score of 1, only has about a ~20% rate of recidivism.
When the underlying distributions for different populations are different (e.g. Black people are more likely to be arrested), using the test fairness definition will result in different False Positive rates. Here is the distribution/frequency with which white and Black people are assigned each score:
However, we shouldn’t see this incompatibility as meaning that all definitions of fairness are equally appropriate.
Two other papers that may be helpful.
Fairness Definitions Explained (Verma and Rubin, 2018): evaluates 20 different definitions of fairness all on the same dataset/case study, which is interesting.