Hi! I’m trying to build an Image Classifier that classifies audio files, but I’m having difficulties turning audio files into images. I’ve tried plotting it then saving the figure, but I had some blank space that I couldn’t get rid of. Can somebody help me solve this issue?
Hi D0rs4n
Perhaps open the wav in Goldwave (free) and use snipping tool to take the image.
I have not tried it.
Regards Conwyn
That would probably work, thank you!
However, I’m looking for some more automatic way, since I have to turn 700 audio files into Spectograms! 
Hi. Please search the forums for the “Deep Learning with Audio” thread.

Maybe https://stackoverflow.com/questions/44787437/how-to-convert-a-wav-file-to-a-spectrogram-in-python3
librosa has a great spectrogram plotting tool.
If you’re using CNNs, then you’ll want to use the mel spectrogram or some other method that gives you a logarithmic frequency scale in the vertical direction, not linear frequency scaling.
This is because the human ear hears relative frequencies in terms of ratios (e.g. harmonics), and the same ratio maps to the same distance on a log plot. Thus the translation invariance of the CNN is amenable to both time (/phase) and frequency when using such log-freq spectrograms.
You might check out this example
Thank you! I indeed am using CNNs, and I used the method Conwyn mentioned , and I got quite interesting results,
Here’s a spectogram representing a voice record of saying the ‘back’ word in an ‘angry’ tone.
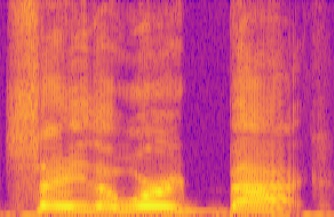
What do you think? Will it be usable?